

 English
Ambari安装及自定义service初步实现
Ambari安装
1 Ambari简介
Apache Ambari项目的目的是通过开发软件来配置、监控和管理hadoop集群,以使hadoop的管理更加简单。同时,ambari也提供了一个基于它自身RESTful接口实现的直观、简单易用的web管理界面。
Ambari允许系统管理员进行以下操作:
1. 提供安装管理hadoop集群;
2. 监控一个hadoop集群;
3. 扩展ambari管理自定义服务功能.
2 集群所需基础条件
2.1 操作系统的需求
• Red Hat Enterprise Linux (RHEL) 版本5.x 或者 6.x (64位) ;
• CentOS版本5.x、6.x (64位) 或7.x;
• Oracle Linux版本5.x 或者6.x (64位) ;
本文档选择的是CentOS版本 6.5 (64位) ;
2.2 系统基础软件的需求
在每一台主机上都要安装以下软件:
(1) yum和rpm (RHEL/CentOS/Oracle Linux);
(2)zypper(SLES);
(3)scp,curl,wget;
2.3 JDK的需求
Oracle JDK 1.7.0_79 64-bit (默认)
OpenJDK 7 64-bit (SLES不支持)
3 安装各项软件前的先决条件
3.1 ambari和监控软件所需条件
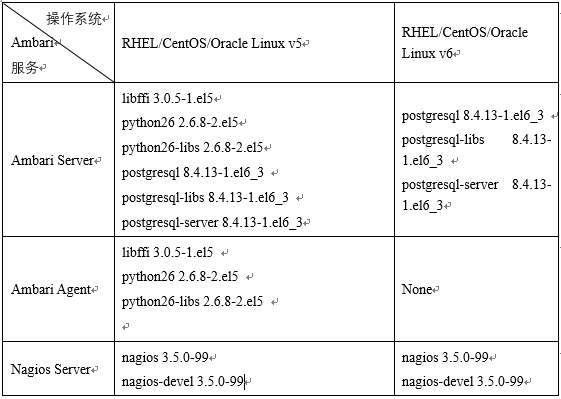
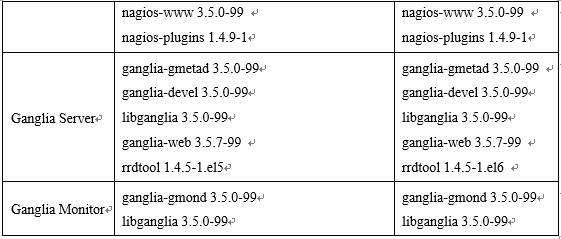
安装ambari之前,为了保证ambari各项服务和各项监控服务的正常运行,根据操作系统的不同,需要确定一些已经安装的软件的版本,以下列出的软件版本必须符合要求。即:如果现有的系统上有以下软件,版本必须与下面列出的版本完全一致,如果没有的话安装程序会自行安装。
图表3-1软件先决配置表
3.2 Ambari与HDP版本兼容性
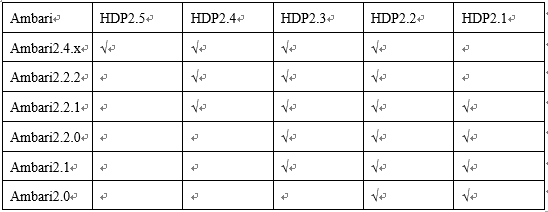
由于软件版本的升级,各版本之间由于版本之间的兼容性可能会导致一些问题。
表格 3-2 版本兼容性
4 安装实例说明
本文所选择的系统与软件版本,如下表所示:
表格 4-1系统与软件版本
![]()
4.1 安装Ambari前的操作系统准备
4.1.1 配置主机名
Ambari配置集群信息的时候是通过全限定主机名来确定集群中的机器信息的,所以必须确保主机名无误。
4.1.2 配置集群信息
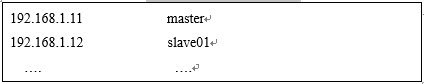
在每一台机器的hosts文件上都要做映射配置,命令如下:
# vi /etc/hosts
然后添加如下内容:
表格 4-2 ip映射信息表
4.1.3 配置ssh免密码互通
首先,在主节点和其他节点上都执行以下命令,以确保每台机器都可产生公钥。
![]()
然后一路回车即可.然后将每个节点的公钥组成一个新的authorized_keys文件,然后将其分发到每个节点中.从而,完成了各个节点的免密登录操作.
4.1.4 配置NTP时间同步
首先在主节点上做如下操作:
(1) 安装时间服务器ntp:
#yum install ntp
(2) 修改ntpd配置文件
(3) 开启时间同步服务器
#sevrice ntpd start
(4) 在其他各个从节点做相同操作,至此ntp同步完成
4.1.5关闭selinux
永久关闭SELinux
# vi /etc/selinux/config
将SELINUX=enforcing改为SELINUX=disabled
重启生效,重启命令为:
# reboot
4.1.6关闭iptables防火墙
永久关闭(需要重启)
# chkconfig iptables off
暂时关闭防火墙服务(需要重启防火墙)
service iptables stop
查看防火墙状态
# chkconfig –list|grep iptables
提示:Linux下的其它服务都可以用以上命令执行开启和关闭操作
重启生效,重启命令为:
# reboot
4.2 创建yum本地源
首先检验主节点是否安装httpd服务器,命令如下:
rpm -qa |grep httd
若没有,则安装,命令如下:
#yum install httpd
启动httpd
#service httpd start
chkconfig httpd on
对文件夹与子文件夹内所有文件授予同一权限,命令如下:
chmod –R ugo+rX /var/www/html
打开网络
vim /etc/sysconfig/network-script/ifcfg-eth0
修改为onboot=yes
安装成功之后,Apache工作目录默认在/var/www/html。
配置:
检查端口是否占用,Apache http服务使用80端口
[root@master ~]$ netstat -nltp | grep 80
如果有占用情况,安装完毕之后需要修改Apache http服务的端口号:
[root@ master ~]$ vi /etc/httpd/conf/httpd.conf
修改监听端口,Listen 80为其他端口。
将所下载的安装文件放在/etc/www/html下,然后启动
[root@ master ~]$ service httpd start
可以在浏览器中查看http://master 看到Apache server的一些页面信息,表示启动成功。
5 完全离线安装Ambari前的准备
离线安装跟在线安装的区别在于yum所使用的仓库的位置不同,即把远程的仓库中的安装包等资源拷贝一份儿放在本地,然后在yum仓库包文件夹中创建这些资源的本地仓库包,即可按照在线安装的方式进行安装就行了。不过离线安装需要先解决Ambari的rpm包的依赖性问题,即首先要确保已经安装了postgresql8.4.3,或者有本地postgresql8.4.3仓库。
5.1 先决条件
Ambari的离线安装,需要使用yum,如果是新安装的操作系统,可能缺少很多必要的条件,以下表格按照从前往后的顺序,依次说明,如果已经实现了某些条件,跳过那些条件即可。
因操作系统中本身自带软件的复杂性,如在安装中提示有其他所需软件或提示现有软件升级,按照提示解决即可.
5.2 建立本地资源库
在集群内部某台机器上安装http服务即可,然后将提供的tar包或者rpm包放置到那台机器上的/var/www/html目录(Apache默认目录)下解压即可,最好在这个目录下新建一个目录,将所有的ambari的tar包和HDP及HDPUTIL的tar包都放置进去并解压,如果机器没有手动安装PostgreSQL,将提供的上述软件的软件包一并放入到本地资源库中即可。
5.3 设置yum不检查gpg密钥
经检测离线安装Hadoop集群时会因为yum检查要安装的软件的gpg密钥而导致错误,此时可通过关闭系统的yum gpg检查来规避错误
# vi /etc/yum.conf
设置gpgcheck属性值为0即可
gpgcheck=0
5.4 安装ambari服务
# yum –install ambari-server
5.5 ambari设置
# ambari-server setup
运行过后则会出现是否进入ambari-server守护进程,选择jdk,配置数据库等信息,可根据系统自身需要进行选择.
当出现“Ambari Server ‘setup’ completed successfully”,则说明Ambari-server配置成功。需要说明的是,此次安装选择的数据库是PostgreSQL数据库,其中用户、数据库等都是提前默认好的;若选择MySQL数据库,则需要在安装Ambari-server之前建好用户、赋予权限、建好数据库等等操作。
然后启动ambari-server,最后根据需要安装hadoop生态中的各项服务.
自定义service服务
1 ambari自定义扩展service
从第一部分可知,ambari具有进行二次开发的功能,主要工作就是将自研的组件等集成到ambari中,并对其进行管理监控.本文主要以集成redis为例进行讲述.
首先,由于service都是隶属于stack的,所以要决定自定义一个service属于哪个stack.,又因为已经安装了HDP2.5.0具有stack,所以,本文将自定的service放置在HDP2.5.0的stack下.新建service名为:redis-service,其中包含结构图如下图所示:
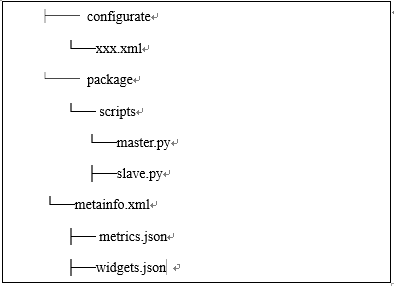
其中configurate中的xml文件主要安装完成配置该模块的调用,package中主要问控制service生命周期的python文件,metainfo.xml文件则主要问定义service的一些属性,metrics.json与widgets.json控制着service的界面图表显示.
其中metainfo.xml实例如下:
1 2 3 4 5 6 7 8 9 10 11 12 13 14 15 16 17 18 19 20 21 22 23 24 25 26 27 28 29 30 31 32 33 34 35 36 37 38 39 40 41 42 | <?xml version="1.0"?> <metainfo> <schemaVersion>2.0</schemaVersion> <services> <service> <name>REDIS-SERVICE</name> <displayName>Reids</displayName> <comment>My Service</comment> <version>1.0</version> <components> <component> <name>MASTER</name> <displayName>Master</displayName> <category>MASTER</category> <timelineAppid>redis</timelineAppid> <cardinality>1</cardinality> <commandScript> <script>scripts/master.py</script> <scriptType>PYTHON</scriptType> <timeout>5000</timeout> </commandScript> </component> <component> <name>SALVE</name> <displayName>Slave</displayName> <category>SLAVE</category> <cardinality>1+</cardinality> <commandScript> <script>scripts/slave.py</script> <scriptType>PYTHON</scriptType> <timeout>5000</timeout> </commandScript> </component> </components> <osSpecifics> <osSpecific> <osFamily>any</osFamily> </osSpecific> </osSpecifics> </service> </services> </metainfo> |
其次,需要创建 Service 的生命周期控制脚本master.py 和 slave.py。这里需要保证脚本路径和上一步中 metainfo.xml 中的配置路径是一致的。这两个 Python 脚本是用来控制 Master 和 Slave 模块的生命周期。脚本中函数的含义也如其名字一样:install 就是安装调用的接口;start、stop 分别就是启停的调用;Status 是定期检查 component 状态的调用。其中master.py与slave.py的模板为:
Master.py
1 2 3 4 5 6 7 8 9 10 11 12 13 | class Master(Script): def install(self, env): print "Install Redis Master" def configure(self, env): print "Configure Redis Master" def start(self, env): print "Start Redis Master" def stop(self, env): print "Stop Redis Master" def status(self, env): print "Status..." if __name__ == "__main__": Master().execute() |
Slave.py
1 2 3 4 5 6 7 8 9 10 11 12 13 | class Slave(Script): def install(self, env): print "Install Redis Slave" def configure(self, env): print "Configure Redis Slave" def start(self, env): print "Start Redis Slave" def stop(self, env): print "Stop Redis Slave" def status(self, env): print "Status..." if __name__ == "__main__": Slave().execute() |
再次,将redis的rpm安装文件放入到HDP安装包的/var/www/html/ambari/HDP/centos6/目录下.
再次,重启ambari-server, 因为 Ambari Server 只有在重启的时候才会读取 Service 和 Stack 的配置。命令行执行:ambari-server restart.
最后,登录 Ambari 的 GUI,点击左下角的 Action,选择 Add Service。如下图:
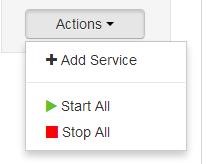
此时就可以在安装service列表中看到Redis服务了.然后检验该服务是否安装成功.
2 ambari实现自定义扩展service界面显示
在第二章的第一节中service自定义中提及metircs.json与widget.json时, 其中Widget 也就是 Ambari Web 中呈现 Metrics 的图控件,它会根据 Metrics 的数值,做出一个简单的聚合运算,最终呈现在图控件中。Widget 则进一步提升了 Ambari 的易用性,以及可配置化。Widget 是显示 AMS 收集的 Metrics 属性.
此处紧接着上节,其中metrics.json模板为:
1 2 3 4 5 6 7 8 9 10 11 12 13 14 15 16 17 18 19 20 21 22 23 24 25 26 27 28 29 30 31 32 33 | { "REDIS-MASTER": { "Component": [ { "type": "ganglia", "metrics": { "default": { "metrics/total_connections_received": { "metric": "total_connections_received", "pointInTime": true, "temporal": true }, "metrics/total_commands_processed": { "metric": "total_commands_processed", "pointInTime": true, "temporal": true }, "metrics/used_cpu_sys": { "metric": "used_cpu_sys", "pointInTime": true, "temporal": true }, "metrics/used_cpu_sys_children": { "metric": "used_cpu_sys_children", "pointInTime": true, "temporal": true } } } } ] } } |
widget.json为:
1 2 3 4 5 6 7 8 9 10 11 12 13 14 15 16 17 18 19 20 21 22 23 24 25 26 27 28 29 30 31 32 | { "layouts": [ { "layout_name": "default_redis_dashboard", "display_name": "Standard REDIS Dashboard", "section_name": "REDIS_SUMMARY", "widgetLayoutInfo": [ { "widget_name": "Redis info", "description": "Redis info", "widget_type": "GRAPH", "is_visible": true, "metrics": [ { "name": "total_connections_received", "metric_path": "metrics/total_connections_received", "service_name": "REDIS", "component_name": "REDIS-MASTER" } ], "values": [ { "name": "total_connections_received", "value": "${total_connections_received}" } ], "properties": { "graph_type": "LINE", "time_range": "1" } } } |
至此,重启ambari-service,命令如下:
1 | ambari-server restart |
3 数据采集及发送
利用shell脚本将redis运行信息数据采集并一次性发送到metrics collector中,脚本如下所示:
1 2 3 4 5 6 7 8 9 10 11 12 13 14 15 16 17 18 19 20 21 22 23 24 25 26 27 28 29 30 31 32 33 34 35 | #!/bin/sh url=http://$1:6188/ws/v1/timeline/metrics while [ 1 ] do total_connections_received=$(redis-cli info |grep total_connections_received:| awk -F ':' '{print $2}') total_commands_processed=$(redis-cli info |grep total_commands_processed:| awk -F ':' '{print $2}') millon_time=$(( $(date +%s%N) / 1000000 )) json="{ \"metrics\": [ { \"metricname\": \"total_connections_received\", \"appid\": \"redis\", \"hostname\": \"localhost\", \"timestamp\": ${millon_time}, \"starttime\": ${millon_time}, \"metrics\": { \"${millon_time}\": ${total_connections_received} } }, { \"metricname\": \"total_commands_processed\", \"appid\": \"redis\", \"hostname\": \"localhost\", \"timestamp\": ${millon_time}, \"starttime\": ${millon_time}, \"metrics\": { \"${millon_time}\": ${total_commands_processed} } } ] }" echo $json | tee -a /root/my_metric.log curl -i -X POST -H "Content-Type: application/json" -d "${json}" ${url} sleep 3 done |
运行如下命令(这里要注意的是参数 1 是 Metrics Collector 的所在机器,并不是 Ambari Server所在的机器):
./metric_sender.sh ambari_collector_host total_connections_received redis
如果过程不出意外,等待2-4分钟界面上即有数据显示.通过上面的操作,可以实现将ambari没有纳入到监控管理的软件进行管理监控。