

 中文
中文As a Product Manager, Do You Really Know about Data Analysis?
Every product manager knows that data analysis is important, but can you give a clear answer to both of these questions?
1. What is data analysis?
2. Why is data analysis so important?
It doesn’t matter if you don’t know the answer, because this article is about to answer it from the following aspects:
1. What is data analysis?
2. Relevant concepts of data analysis
3. How to conduct data analysis?
4. How to measure and collect data?
5. How to do data analysis report?
6. The relationship between data analysis and products
What is data analysis?
In short, data analysis represents product status, user behavior, and what users click on and so on. Although the data represents the state of the product, it does not indicate the cause of the state of the product. Data analysis cannot rely solely on a single measurement data, which should be based on a series of converging data.
For example, if you want to analyze the state of an object, we can’t use temperature only, you have to combine other data like position, velocity, composition, environment temperature etc. to implement data analysis. Suppose the velocity is 0, the object is 1 meter above the ground, and the surrounding temperature is the same as the object, and you can conclude that the object is static.
Similarly, when you analyze product status and user behavior, the more metrics you gather, the better for you.
Relevant concepts of data analysis
To get the most out of data analysis, you need to be very knowledgeable about the concepts of data analysis. These concepts include:
• Data points
• Segmentation
• Funnel
• Cohorts
Data points
Data points, the single point of data. A data point measures a particular project, including measurement data and time.
Accurate data points are the premise of our chart of product development trends.
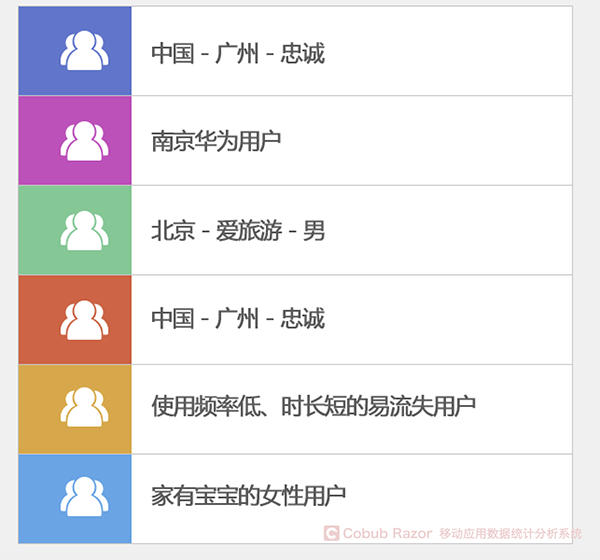
Segmentation
Segmentation is based on user’s common characteristics and product usage pattern.
Segmentation is based on but not limited to:
• Technology (browser, operating system, equipment, etc.)
• Behavior (first time visit, return visit, etc.)
• Demographic (language, country, etc.)
If you do not do segmentation by the above characteristics, you have to do it by the ones that can be measured. For example, user gender is a feature that can be measured. As long as we add gender to the user profile, we can collect relevant data.
You can understand the user’s potential behavior patterns through segmentation. Average data masks these patterns of potential behavior. For example, you add first visits vs return visits as the segmentation feature, although the average page views is 2, you find that for first visits, the average page views is 1.2, the average page views of return visits was 3.4. Without segmentation, the difference in page views of first-time visitors and return visitors will be covered by the average page views.
With segmentation, you can focus on the main target user groups. For example, if your target users are located in eastern China, you only need to analyze the user behavior in different provinces in eastern China instead of analyzing users from all around China to optimize the product to adapt to the targeted users’ needs.
Funnel
The funnel model is mainly used for daily data operation and data analysis, such as flow monitoring and product target transformation.
To achieve the goal, the user performs a series of actions. For example, on the e-commerce platform, users will perform the following operations to achieve the purpose of purchase:
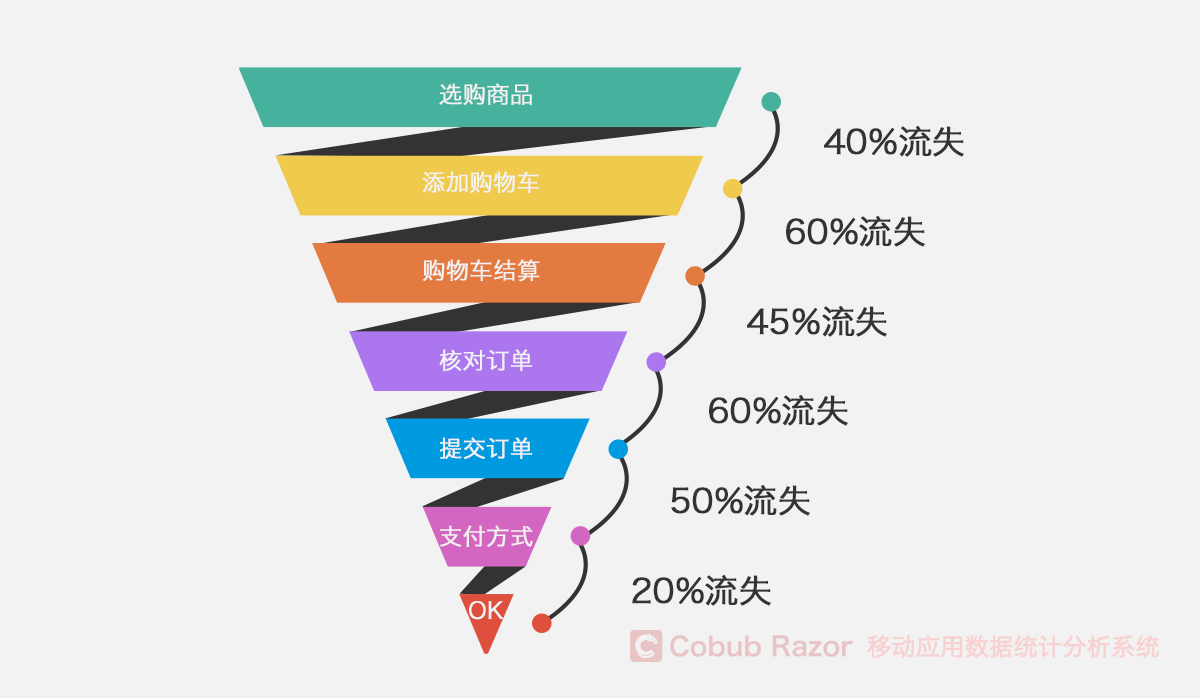
Through the funnel model, we can find out where the user is losing and find out the reasons for the loss through the investigation and analysis.
Cohorts
Cohorts is similar to segmentation, the difference is that cohorts is to compare and analyze user behavior over time.
Cohorts is helpful for measuring the long-time value of users.
Cohorts can compare differently, for example, we can compare a week ago registered users and registered users, a month ago can also compare the registered user of a particular date. If we don’t have a group for a week ago and a month ago, the new user will disturb our analysis of the user behavior during these two periods. When compared to a user of a particular time period, we can measure the impact of a marketing campaign or a product’s function update on user behavior.
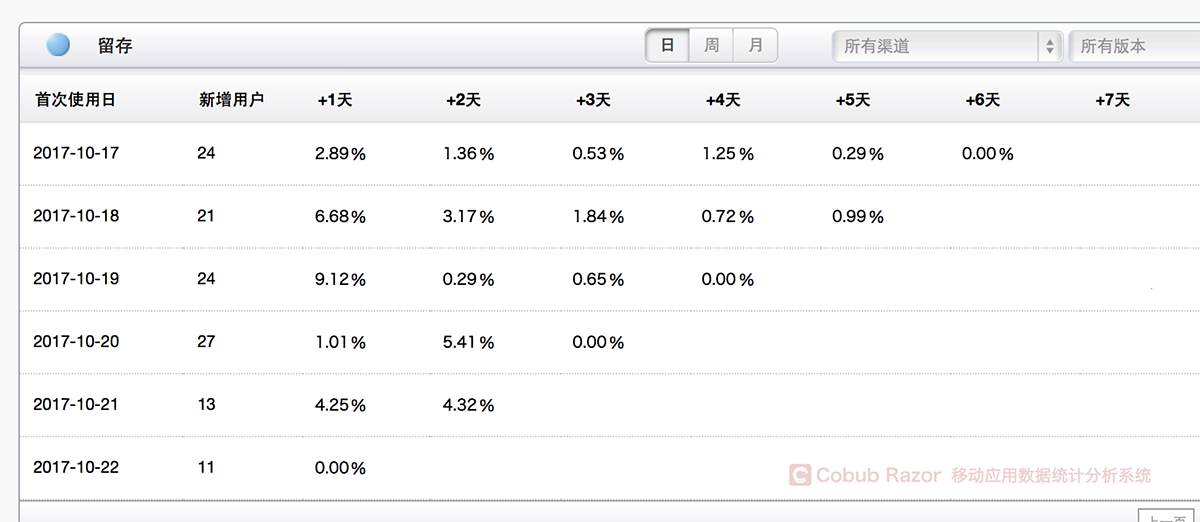
The figure above is a retention diagram based on user registration time. On October 8, the number of users remained significantly higher compared with other users. When we look at this data, we can explore what is causing the change in user retention.
How to conduct data analysis?
Product managers are exposed to massive amounts of data, so how do we perform data analysis? We need to make the following plan:
1. Define product vision
2. Define KPI that meets product vision
3. Definitions allow us to achieve the metrics of KPI
4. (Through user behavior logging) define the funnel that affects measurement
In order to make a better plan, we need to understand the relevant concepts in the plan.
Product vision
Product vision refers to product usage and target users. In short, “what problems does the product solve for users?” Without product vision, all of our next action is a waste of time.
KPI
KPI measures product performance. La new, retained, active, transmutation and so forth are the categories of KPIs. We can also use KPIs to set product development goals, such as increasing user registration by 20% or increasing the purchase conversion rate by 30%. KPIs should be suitable for the stage of the product. If we are just starting out, the main KPI is the user registration, not the user activity.
Metrics
Metrics are the means to achieve KPI. Metrics generally have conversion rate, purchase rate, and so on. By computing two or more data points, we can get metrics. At the same time, the change trend of measurement indicators is also the basis of product improvement.
Funnel
The important funnel will change the metric in some way. After establishing the product use process/user behavior log, we develop the relevant funnel model based on the metrics and user behavior. The funnel model produced by the registration rate and the conversion rate is not possible.
Getting data points
Obtaining measurable data points to achieve KPIs, calculate measurement indicators data, make funnels significant.
The plan is not static, we need to update the plan according to the product vision and KPI.
How to measure and collect data?
There are two methods: establishing an internal analysis system or relying on a third-party analysis system. The internal analysis system can be customized based on metrics. The downside is that we need to build and maintain resources individually.
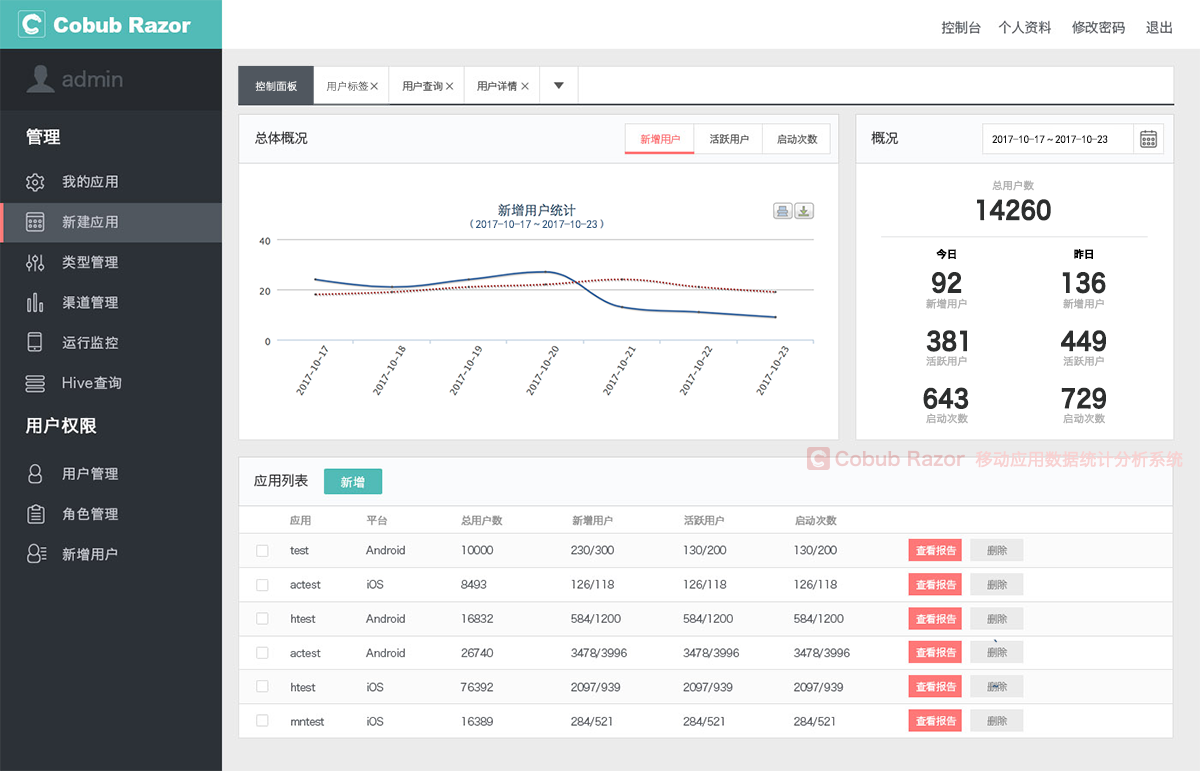
External analysis systems, such as Google Analytics, Mixpanel, KISSmetrics, etc., are good options. Third-party analysis systems are easy to implement without wasting the resources needed to build and maintain them. Cobub Razor is a professional APP data statistical analysis tool in China, which supports privatization deployment. The data is flexible and safe. It is a good choice.
How to do data analysis report?
Usually we do data analysis reports by making comparison charts and trend charts.
A comparison chart shows a change in a metric between two point points, such as a metric that changed between last week and this week. It allows us to see whether there are large fluctuations in the metric between two time points.
A trend chart shows changes in a metric over a period of time, such as changes in a metric over the past month. It shows the direction of the measure, indicating whether the product is performing — better, worse, or not?
The report identifies the problem and then tries to answer “why does XX happen?” “Why does YY change?” These problems, we can optimize and improve the product.
The relationship between data analysis and products
We improve the product according to the data analysis results. If there is no data analysis, we can easily change the product blindly and make head decisions. If there is no data analysis, we cannot know the effect of product change. In the process of product development, we need to constantly conduct data analysis to ensure that our products are developing according to our expectations.
To ensure that products are in a leading position, product managers must know what data analysis is and the importance of data analysis. Hope this article can be helpful to the general product manager.