

 中文
中文The Construction and Deployment of ELK Real Time Log Analysis Platform
1. The Initial Contact with ELK
1.1 Why ELK?
Logs mainly include system logs, application logs and security logs. The system operation and development personnel can log to understand the hardware and software information of the server, check the errors in the configuration process and the causes of the errors. The log can understand the server’s load, performance security, and take timely corrective actions to correct errors. In general, logs are stored separately on different devices. If you manage dozens or hundreds of servers, you’re still using the traditional method of logging each machine in turn. It feels cumbersome and inefficient. It is imperative that we use centralized logging management, such as open source syslog, to collect and summarize log collection on all servers. Centralized management after logging, log statistics and retrieval has become a more troublesome thing, normally we use grep, awk and wc Linux commands can realize retrieval and statistics, but to demand a higher query, sorting and statistics requirements and the huge machine quantity still use this way to avoid a bit overwhelmed.
Elasticsearch is an open source, distributed search engine, its features are: distributed, zero configuration, automatic found that automatic fragmentation index, index mechanism, a copy of the restful style interface, multiple source, automatic search load etc.
Logstash is a fully open source tool that allows you to collect, filter, and store your logs for later use (for example, search).
Kibana is also an open source and free tool that Kibana can provide a log-friendly Web interface for Logstash and ElasticSearch to help you gather, analyze, and search important data logs.
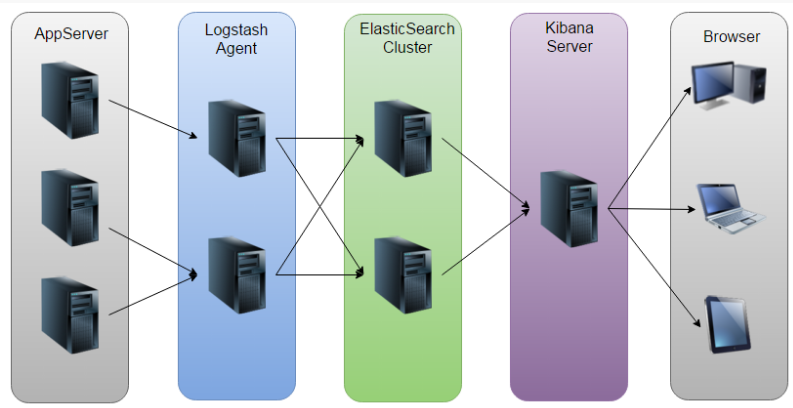
ELK Architecture Diagram
Elasticsearch download address: https://www.elastic.co/downloads/elasticsearch (the latest version: 5.4.3)
Logstash download address: https://www.elastic.co/downloads/logstash (the latest version: 5.4.3)
Kibana download address: https://www.elastic.co/downloads/kibana (the latest version: 5.4.3)
1.2 Java 8
Elasticsearch is recommended to use java8, so install the java8 first.
1.3 Elasticsearch
The security mechanism of elasticsearch is not allowed to start with root, so new user elk: elk.
Start elasticsearch with elk users:
1 2 | $ su - elk $ elasticsearch-5.4.3/bin/elasticsearch & |
After installation: curl localhost: 9200 returns the following content to indicate success.
1 2 3 4 5 6 7 8 9 10 11 12 13 | { "name" : "aQgGH94", "cluster_name" : "elasticsearch", "cluster_uuid" : "BjFsa-KxQdSnP58Enrr6NA", "version" : { "number" : "5.4.3", "build_hash" : "eed30a8", "build_date" : "2017-06-22T00:34:03.743Z", "build_snapshot" : false, "lucene_version" : "6.5.1" }, "tagline" : "You Know, for Search" } |
Problems that may occur in the process of installation and soutions: http://blog.csdn.net/leehbing/article/details/74627134
1.4 Kibana
Modify configuration file kibana-5.4.3-linux-x86_64/config/kibana.yml:
# The Elasticsearch instance to use for all your queries.
elasticsearch.url: “http://localhost:9200”
Perform:
1 2 | $ su – elk
$ ./kibana |
1.5 Nginx
The previous kibana can only be accessed using localhost, which USES a reverse proxy to enable other machines to access, and this article USES nginx to do this.
Modify configuration file nginx/nginx.conf:
The default server {} is removed, Add: include conf.d/*.conf;
1 | $ vi nginx/conf.d/kibana.conf |
1 2 3 4 5 6 7 8 9 10 11 12 13 14 15 16 17 | server { listen 80; server_name bogon; #机器的hostname # auth_basic "Restricted Access"; # auth_basic_user_file /etc/nginx/htpasswd.users; location / { proxy_pass http://localhost:5601; #范文kibana的地址 proxy_http_version 1.1; proxy_set_header Upgrade $http_upgrade; proxy_set_header Connection 'upgrade'; proxy_set_header Host $host; proxy_cache_bypass $http_upgrade; } } |
1 | $ ./nginx/sbin/nginx #启动nginx |
1.6 Logstash
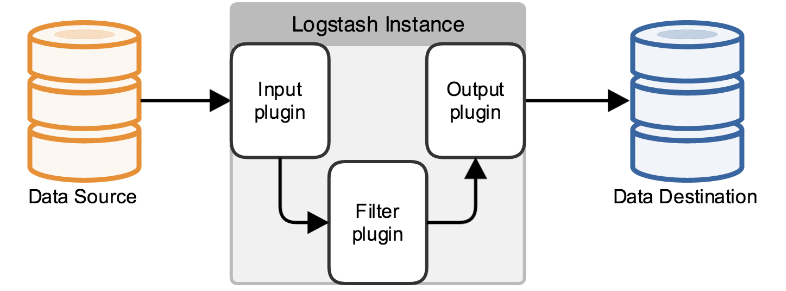
In fact, it’s just a collector, and we need to specify Input and Output for it (Input and Output, of course, can be multiple).
Create a new index profile
1 2 3 | $ cd logstash-5.4.3/bin $ mkdir conf $ vi conf/logstash-indexer.conf |
1 2 3 4 5 6 7 8 9 10 | input { file { path => ["/var/opt/log/a.log","/var/opt/log/b.log"] } } output { elasticsearch { hosts => ["localhost:9200"] } stdout { codec => rubydebug } } |
The above steps are to create a configuration file called log-indexer.conf, input {file {…The}} section specifies the location of the log file (multiple files), generally the log file that the application log4j outputs. The output part is said to save the contents of the log file to elasticsearch, hosts the corresponding here is an array, you can set up multiple elasticsearch host, equivalent to a log file content, can be saved to multiple elasticsearch.Stdout, which represents the standard output of the terminal, is easy to verify if it is running properly when deployed, and can be removed after verification is passed.
1 | $ ./logstash -f conf/logstash-indexer.conf #启动logstash |
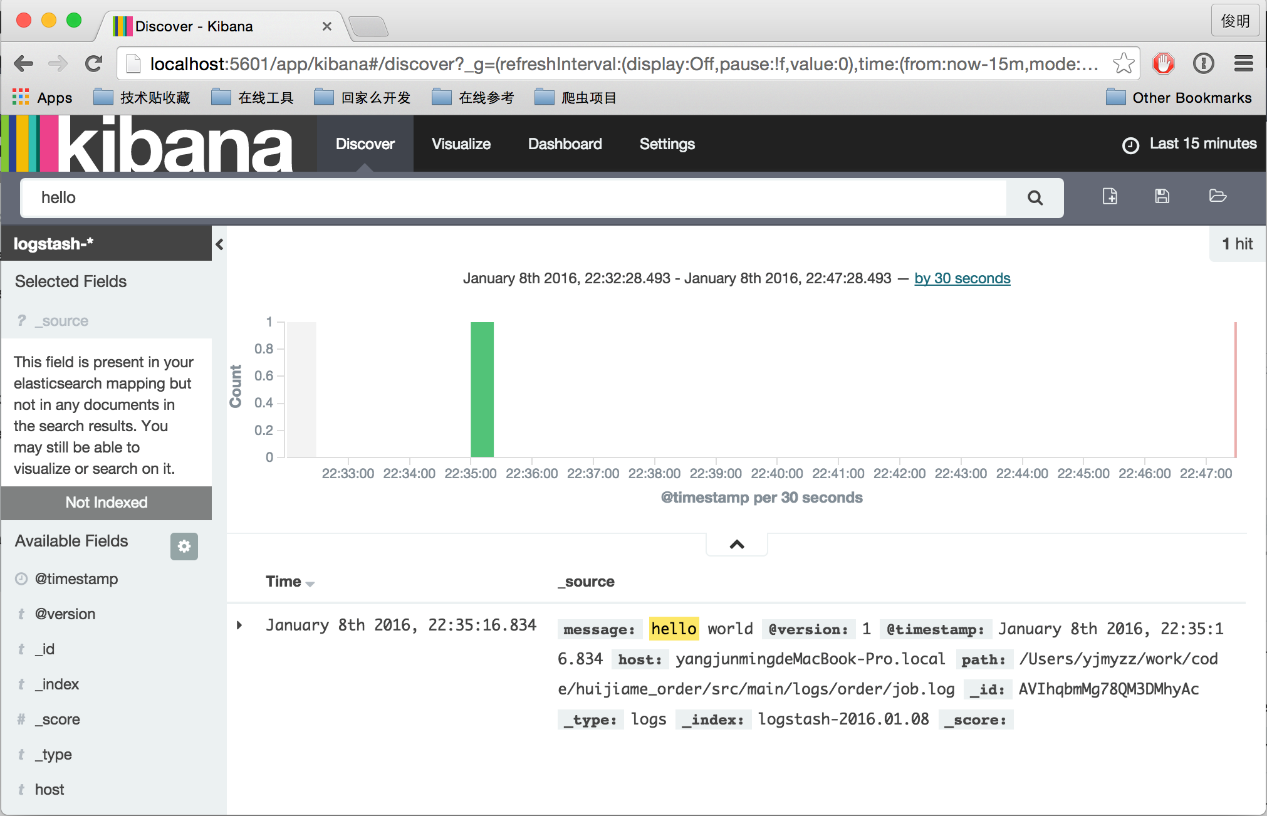
Wait a moment, and if you see the Logstash startup completed, then the startup succeeds.Then, open a terminal window and grab a text editing tool (such as vi) and write something to/var/opt/log/a.l og, such as hello world, and save it.Observe the terminal running window of logstash, if there is something output, if there is a similar output:
1 2 3 4 5 6 7 | { "path" => "/var/opt/log/a.log", "@timestamp" => 2017-07-09T03:17:28.001Z, "@version" => "1", "host" => "bogon", "message" => "hello word" } |
Enter http://192.168.1.139 in the browser, which will jump to the kibana page for the first time. You will be prompted to Create index and click the Create button directly.
2. Sample Application Scenarios
2.1 Collect Logs for Multiple Servers
Install Filebeat on the client server and send the log to logstash.
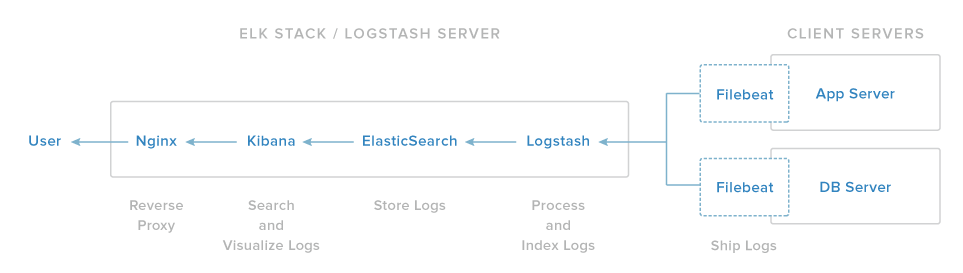
The illustration
2.1.1 Denerate SSL Authentication
Because you want to use Filebeat to send the log from the client to ELK, you need to create the SSL authentication and the secret key pair.Filebeat USES this authentication to identify ELK.There are two ways to generate SSL authentication.If there is already a DNS setting, you can make the client recognize the IP address of the ELK server, and use the second method, otherwise use the first method.
The first method: IP address
If there is no DNS Settings (DNS Settings can generate log client server to identify the ELK server IP address), ELK server’s IP address must be added to the SSL certification subjectAltName (SAN) domain.
$vi /etc/pki/TLS/openssl. CNF # edit openssl configuration file
Find the [v3_ca] section and add subjectAltName = IP: ELK_server_private_ip (ELK_server_private_ip for the IP address of ELK)
Use the following command to generate SSL authentication and private keys
1 2 | $ cd /etc/pki/tls #在/etc/pki/tls/目录下 $ openssl req -config /etc/pki/tls/openssl.cnf -x509 -days 3650 -batch -nodes -newkey rsa:2048 -keyout private/logstash-forwarder.key -out certs/logstash-forwarder.crt |
The generated log-forwarder.crt file will be copied to all servers that send logs to logstash.
The Second method: FQDN (DNS)
Directly use the following command to generate SSL authentication and private key (in /etc/pki/TLS/directory) (ELK_server_fqdn: FQDN of the ELK server)
1 2 | $ cd /etc/pki/tls $ openssl req -subj '/CN=ELK_server_fqdn/' -x509 -days 3650 -batch -nodes -newkey rsa:2048 -keyout private/logstash-forwarder.key -out certs/logstash-forwarder.crt |
2.1.2 Denerate SSL Authentication
The Logstash configuration file USES the json format, and the configuration file consists of three parts: inputs, filters, and outputs.
1 | $ vi bin/conf/02-beats-input.conf |
1 2 3 4 5 6 7 8 | input { beats { port => 5044 ssl => true ssl_certificate => "/etc/pki/tls/certs/logstash-forwarder.crt" ssl_key => "/etc/pki/tls/private/logstash-forwarder.key" } } |
Describe a beats input, listen to TCP port 5044, and use the SSL authentication you created earlier, namely the secret key.
1 | $ vi bin/conf/10-syslog-filter.conf |
1 2 3 4 5 6 7 8 9 10 11 12 13 | filter { if [type] == "syslog" { grok { match => { "message" => "%{SYSLOGTIMESTAMP:syslog_timestamp} %{SYSLOGHOST:syslog_hostname} %{DATA:syslog_program}(?:\[%{POSINT:syslog_pid}\])?: %{GREEDYDATA:syslog_message}" } add_field => [ "received_at", "%{@timestamp}" ] add_field => [ "received_from", "%{host}" ] } syslog_pri { } date { match => [ "syslog_timestamp", "MMM d HH:mm:ss", "MMM dd HH:mm:ss" ] } } } |
The syslog type (Filebeat) logs are filtered, and the syslog logs are parsed by grok
To make it structured and easy to query.
1 | $ vi bin/conf/30-elasticsearch-output.conf |
1 2 3 4 5 6 7 8 9 | output { elasticsearch { hosts => ["localhost:9200"] sniffing => true manage_template => false index => "%{[@metadata][beat]}-%{+YYYY.MM.dd}" document_type => "%{[@metadata][type]}" } } |
Store beats data to elasticsearch (localhost: 9200) and set index and type
If you want to add a filter to other applications that use Filebeats, make sure you name them correctly between the input and output files (for example, between 02 and 30 )
2.1.3 Load Kibana Dashboard
Elastic provides some kibana sample dashboard and Beats index model, although this article does not use the dashboard, but still will load the dashboard, because we can use they contain Filebeat index model.
Download the dashboard sample file:
1 2 3 4 5 | $ curl -L -O https://download.elastic.co/beats/dashboards/beats-dashboards-1.1.0.zip $ yum -y install unzip #安装unzip $ unzip beats-dashboards-*.zip $ cd beats-dashboards-* $./load.sh #加载仪表盘样例 |
The following index schema has just been loaded:
[packetbeat-]YYYY.MM.DD
[topbeat-]YYYY.MM.DD
[filebeat-]YYYY.MM.DD
[winlogbeat-]YYYY.MM.DD
When using kibana, the Filebeat index mode is selected as the default.
2.1.4 Load the Filebeat Index Template
Because you intend to send the logs to elasticsearch using FIlebeats, you should load the Filebeat index template.This index template will configure elasticsearch to analyze the Filebeat field that is sent in in a smart way.
1 2 3 4 | [packetbeat-]YYYY.MM.DD [topbeat-]YYYY.MM.DD [filebeat-]YYYY.MM.DD [winlogbeat-]YYYY.MM.DD |
Now the ELK server is ready to accept Filebeat data.
2.1.5 Install the FileBeat Package on the Client Host
Copy SSL authentication
On the ELK server, copy the SSL certificate you created earlier to the client server.
1 2 | $ curl -O https://gist.githubusercontent.com/thisismitch/3429023e8438cc25b86c/raw/d8c479e2a1adcea8b1fe86570e42abab0f10f364/filebeat-index-template.json #下载Filebeat索引模板 $ curl -XPUT 'http://localhost:9200/_template/filebeat?pretty' -d@filebeat-index-template.json #加载此模板 |
On the client:
1 | $ scp /etc/pki/tls/certs/logstash-forwarder.crt user@client_server_private_address:/tmp |
Install Filebeat package
Ready to filebeat 5.5.0 – Linux – x86_64. Tar. Gz
Configuration Filebeat
Configure Filebeat to connect to Logstash
On the client server:
1 2 | $ mkdir -p /etc/pki/tls/certs $ cp /tmp/logstash-forwarder.crt /etc/pki/tls/certs/ |
1 | $ vi filebeat/filebeat.yml |
Note that the Filebeat configuration file is in YAML format, so the number of Spaces is important.
Now Filebeat will send the syslog messages and secure files to the ELK server on the client server!Other client server configuration.
2.2 Kibana Case Data
The data is imported directly into elasticsearch, which assumes that data from the data source is stored in the elasticsearch, and then USES kibana to visualize the data.
Import the following three data:
1. All of Shakespeare’s works have been properly parsed into fields: Shakespeare. Json.
2. Random generated fictitious account data: account.json
3. Randomly generated log files: logs. Jsonl
The data format for shakespear. Json is as follows:
1 2 3 4 5 6 7 8 9 10 11 12 13 14 15 16 17 18 19 20 21 22 23 24 25 26 27 28 | filebeat: prospectors: #定义了哪些日志文件可以被传送给Logstash,并且该如何处理它们 - #表示开始定义prospector paths: - /var/log/secure #表示传送secure和messages日志 - /var/log/messages # - /var/log/*.log input_type: log document_type: syslog #传送的日志类型为syslog,其也是Logstash过滤器配置的 registry_file: /var/lib/filebeat/registry output: logstash: hosts: ["elk_server_private_ip:5044"] #ELK服务器的IP,发送至Loastash bulk_max_size: 1024 tls: # List of root certificates for HTTPS server verifications certificate_authorities: ["/etc/pki/tls/certs/logstash-forwarder.crt"] shipper: logging: files: rotateeverybytes: 10485760 # = 10MB |
The data format for shakespear. Json is as follows:
1 2 3 4 5 6 7 8 | { "line_id": INT, "play_name": "String", "speech_number": INT, "line_number": "String", "speaker": "String", "text_entry": "String", } |
The main data format of logs. Jsonl is as follows:
1 2 3 4 5 6 7 8 9 10 11 12 13 | { "account_number": INT, "balance": INT, "firstname": "String", "lastname": "String", "age": INT, "gender": "M or F", "address": "String", "employer": "String", "email": "String", "city": "String", "state": "String" } |
Set up three index modes on the kibana interface, corresponding to the indexes that have just imported as:
1 2 3 4 5 | { "memory": INT, "geo.coordinates": "geo_point" "@timestamp": "date" } |
Then use the visualize function of kibana to customize the diagram below:
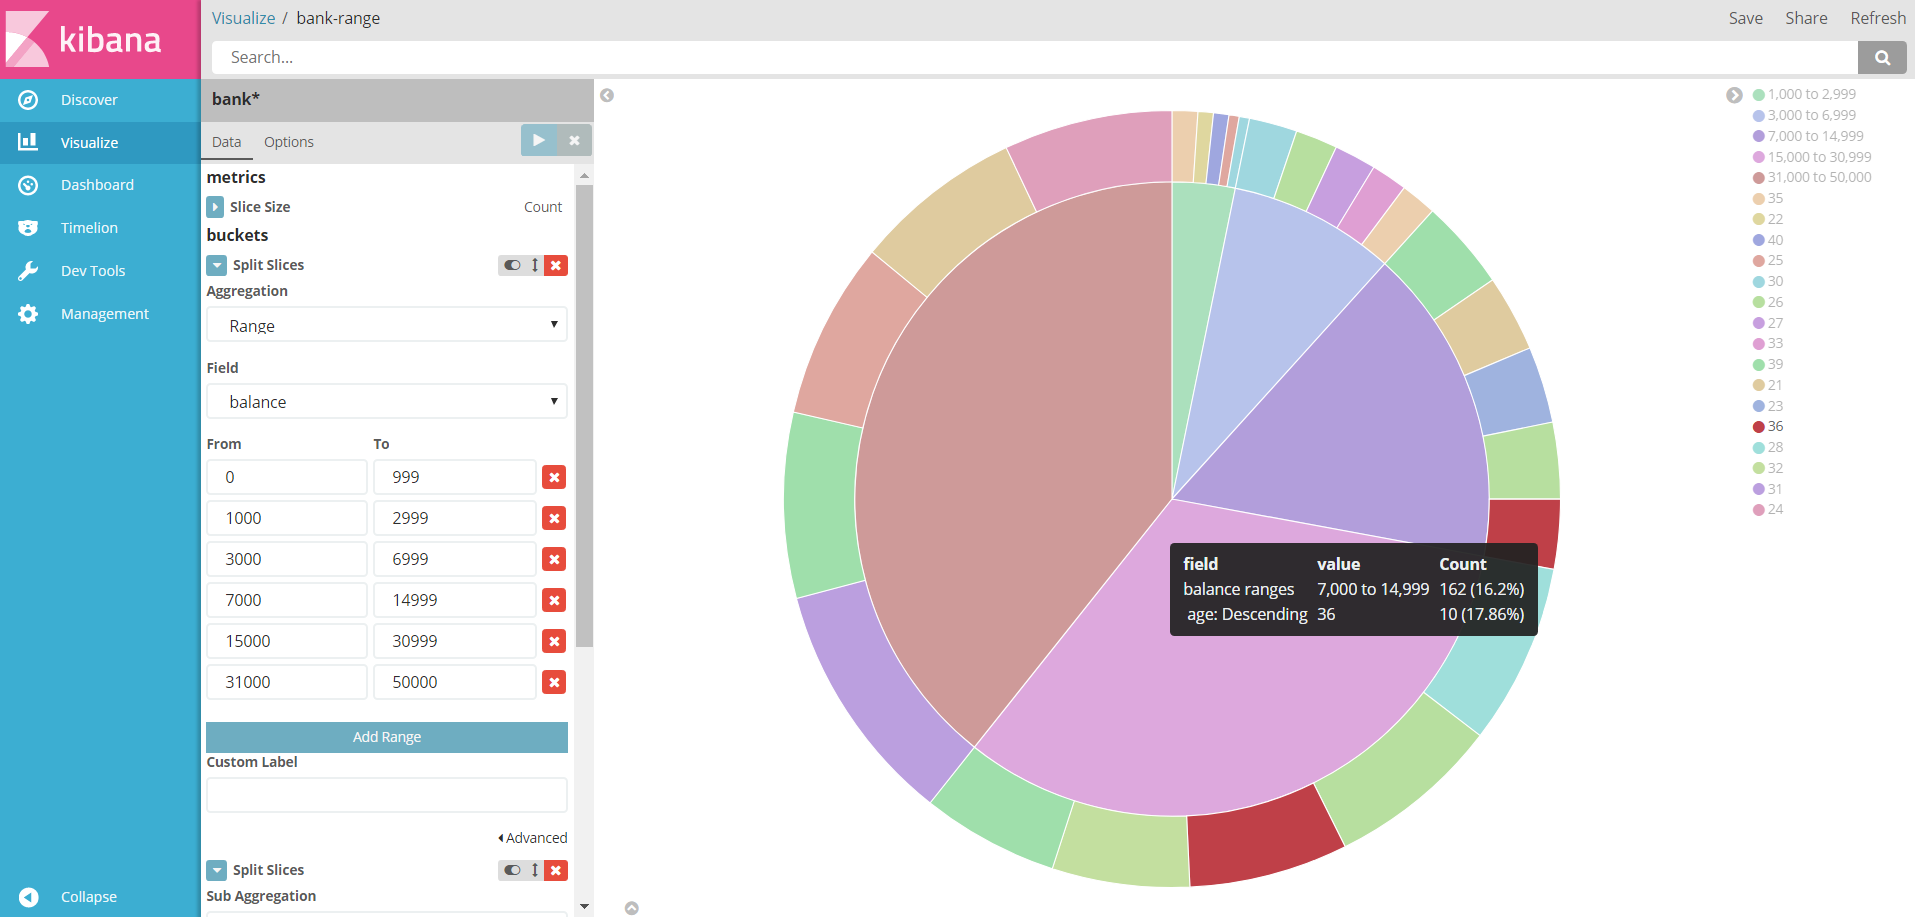
The graph account falls on a different salary range, and the outer circle represents the age of the pay owner.
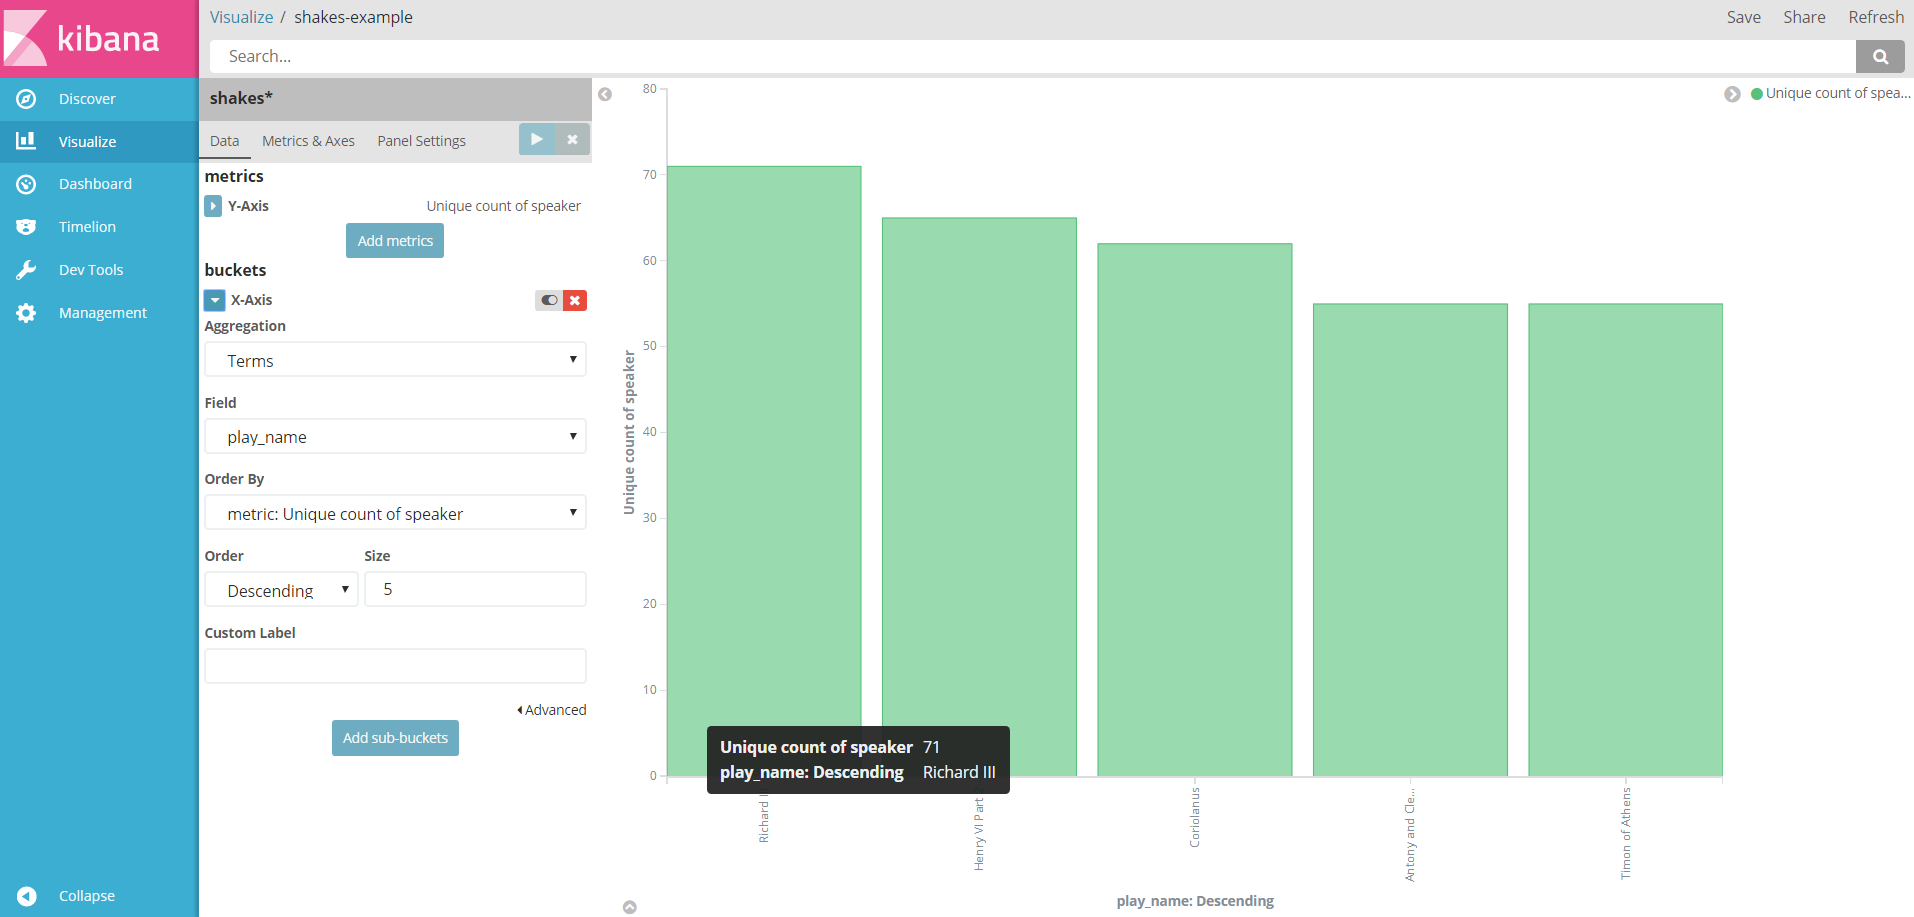
The number of behind-the-scenes figures in each play.
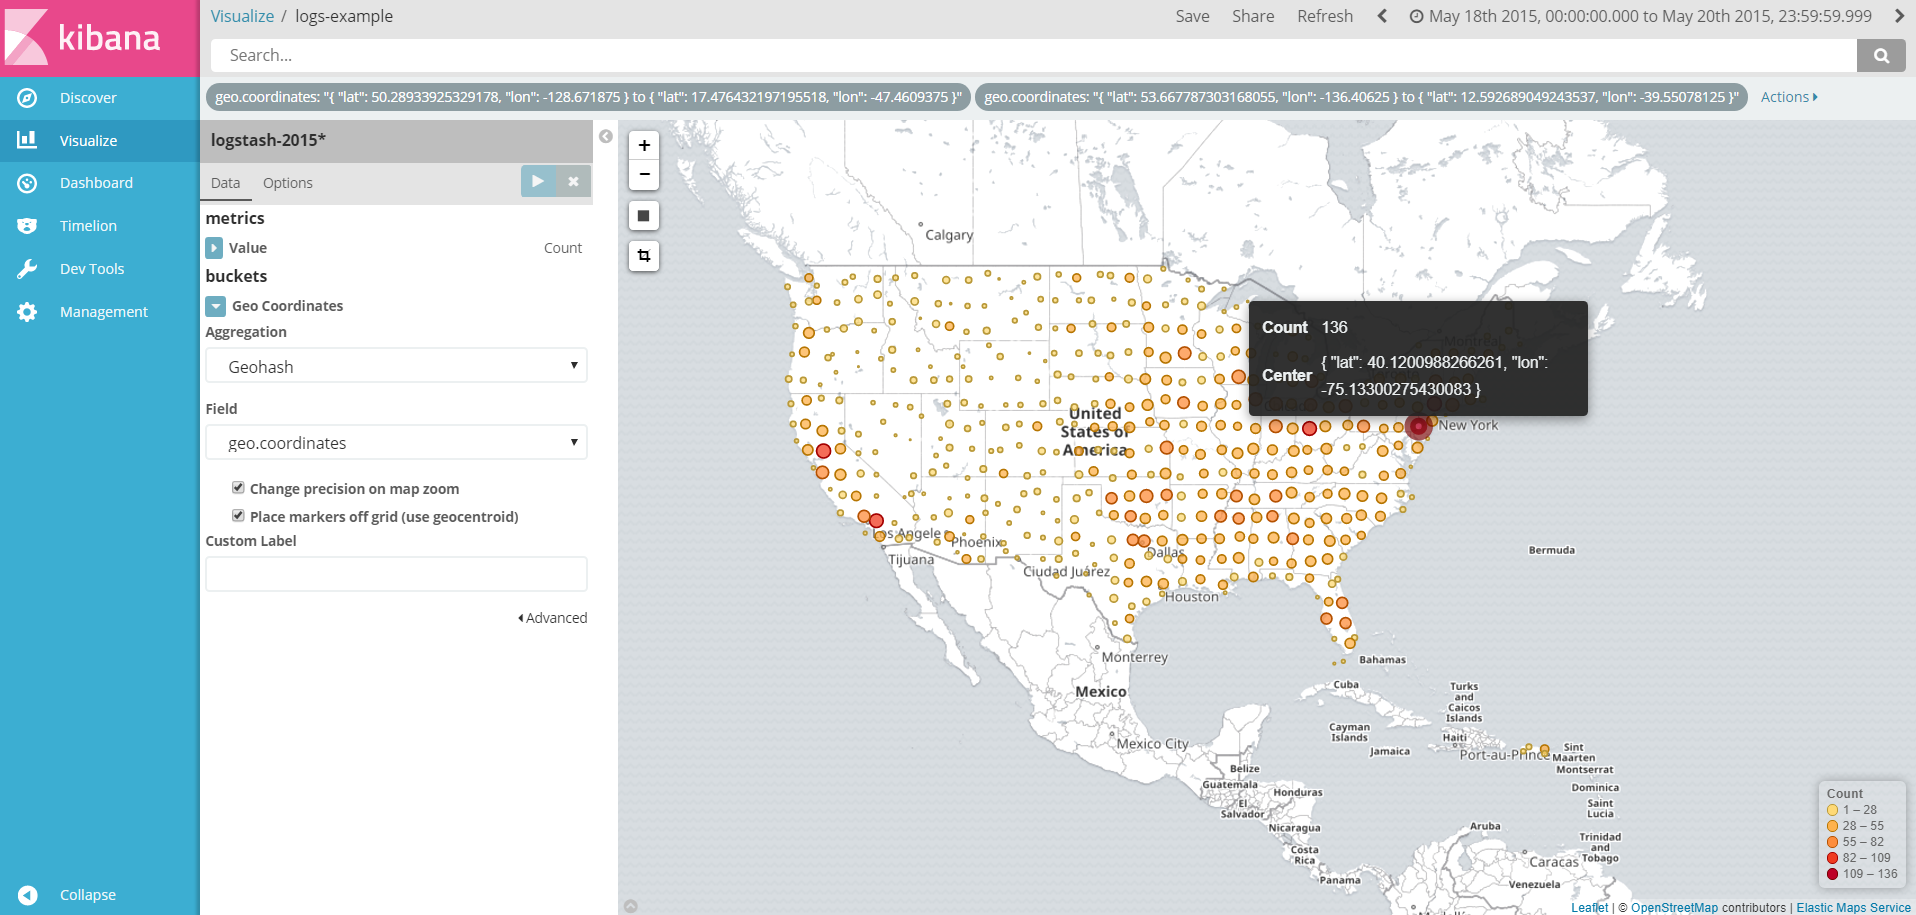
Figure visualization of some geographic data.