

 中文
中文Three Years Running, a Million Micro-service Data Analysis Framework
Language knowledge used in architecture:
In recent years, data analysis has developed rapidly and we have also made a micro data analysis tool.The product has been successfully operated for three years, fulfilling the daily life of millions of enterprises.The product structure is very simple, with the simplest language in the world PHP, the most common database mysql, the server can choose apache or choose nginx, all your own preferences.
1. Microservice architecture diagram:
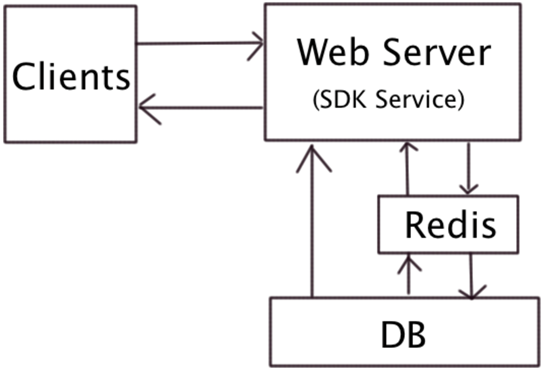
Whole flow chart:
(1) The SDK uploads data to the server, and if redis is installed, the data will be advanced to redis and then periodically extract the data to the DB server. Redis can greatly improve parallel data processing capabilities.
(2) The database collects raw data, and the stored procedure calculates the data according to different dimensions according to different dimensions, and the data summary table.
(3) Front desk report presentation, real-time report, hour report and day report data display. It’s better to write and separate.
2. Functional framework
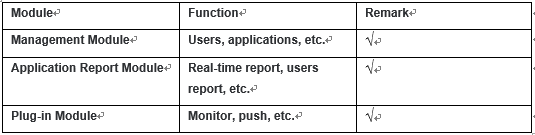
The functional architecture includes functions, roles, and permissions. The function is enterprise service, the user USES each function, is the enterprise every service. The role is the user action category, the function and the role’s correspondence and permissions. Understand the status of the system architecture and start with the functional architecture.
3. Application framework
The application architecture includes existing architecture diagrams, web application status, and interface architecture. Among them, the interface is the key to the application layer, which is the interaction between programs.
The main interface includes clientdata usinglog event and errorlog, etc.
The SDK sends data to the background periodically through the interface.
The application architecture lists the end-to-end invocation relationships.
4. Data design
Two databases, about one hundred tables. The design of the database relies on business data, classifies business data, and results in an E_R diagram of data design. The data design is completed and the final database design comes out. As long as early design of the database, it can be easy to scale, easy to split. Statistical classes are mainly divided into statistical dimensions, which are user, device, error information, etc.
(1) Data handling capacity
The number of live millions, the number of launches is about two million, and the number of events and page views is at least 300 to five million, with an average of 500,000 data per hour. During operation, the customer data volume is concentrated in the morning and evening peak. According to the special situation of customers, some tasks are arranged in the leisure time, such as daily tasks, weekly tasks, monthly tasks, etc. Good hardware configuration is a good helper for data processing, and larger memory faster drives can definitely make data flow fast.
(2) Data cleaning and read-write separation
A large amount of raw data is entered into the database, which is then processed into garbage data. When all report data is counted and writes to the various dimension tables, the data needs to be removed periodically.
The front desk report shows that data is best separated from the storage analysis database.
5. Physical Schema
A microservice’s physical architecture requires very little machinery, and a machine can run. Analysis statistics is mainly about data processing ability, the database server needs two, and the web side needs one. Many years of operation result and database processing capacity are the biggest bottleneck of statistical analysis.
6. The direction of continual optimization
(1) Data read and write separation, data cleaning.
(2) Concurrent volume.
7. Customers
Customer’s most important data:
The most important thing for each customer is user table, user’s new status, user activity, user retention. Different customers require different user requirements to determine whether the user is using the machine, and the user has a mapping relationship with the device number and user ID (user number).
Event data is also important, relational conversion rate.
Page access is just as important as events.
Error data can detect bugs in the application.
Different customers, different usage scenarios have different requirements for indicators.