

 中文
中文To Marketers: How Do You Not Rely on Analysts to Do Your Own Data Analysis?
In this era of data driven operation, data is not only engineers and analysts, at work and operating requirements practitioners have certain ability of data analysis, more people say that “data analysis ability is the future operation of watershed”. From my point of view, I really think the data can promote the operation strategy and work.
But running children’s shoes is mostly data small white, without programming and technical foundation, how should we analyze and use good data? Today, starting from the common data problem, I hope that you can quickly get the data analysis to make the data better for the work service, and don’t waste the data’s value.
What data should I analyze? From what Angle?
This is the biggest headache for marketers, not knowing which data to focus on, analyzing what data to analyze, and not knowing exactly where to analyze the data. Some common data indicators are compiled for the friends, and some applicable analysis angles are summarized
1 Common data indicators of Internet operation concern
• Traffic
1)visit:PV、UV、IP(commonest);Jump rate, average length of visit, average access to pages, etc. Use devices, operating systems, browsers, geographical distribution, and other access behavior;
2)register:Registration number, registration trend, accumulative registration number, achievement rate, etc.;
3)Channel & promotion:Source channel distribution, total consumption, display quantity, click rate, click rate, average click price, conversion rate, conversion cost, ROI, etc.
• User
1)Active/login:DAU、WAU、MAU、Active rate, login, etc;
2)Retention:The retention rate, the retention rate of the week, the retention rate of the month and the retention rate were also analyzed.
3)Loss: loss of data is easy to forget, including loss rate, loss, average daily turnover, etc.
4)Pay: the number of paid, the conversion rate, the average amount of the order, etc., more of the order data;
5)Other: daily number of comments, number of people, share and so on
6)Profile picture: on one hand, analyze user attributes: focus on age, gender, education, occupation, region, marital status, income, interest, etc. On the other hand, analyze user behavior: login frequency, activity rate, cumulative consumption amount, recent purchase, purchase times, repurchase rate, etc.
• order: The number of people paid and the number of new subscribers; Total amount, daily order number, average daily turnover, customer unit price; Paid amount, paid gross profit, paid profit, repurchase rate, ARPU, paid each route conversion, etc.;
• content: PV、UV;UGC, PGC,Number of articles, number of followers, number of reading, number of interactive (comments, thumb up, etc.), transmission number (forward, sharing, etc.);
• activity:active pagePV,UV,New number, participation number, the number of login, transformation, transformation to clinch a deal amount, ARPU, the number of coupons issued/using, marketing costs, conversion rate, the number of ROI, sharing, sharing number, etc., the data will depend on the activity type;
• service:E-commerce, O2O and other industries are easy to deal with, including the number of consultants, the conversion rate, the return rate, the refund rate, the rating, the rating, the rate of complaints, etc.
• APP:The number of downloads, number of activations, the number of new registrations and the cost of customers. Number of starts, number of starts and length of stay; Push arrival rate, opening rate, etc. Other reference data.
2. Applicable analysis Angle and method
Data analysis has all kinds of lofty principles of analysis, such as AARRR model, 5W2H, etc., but operation is not a professional data analyst, it is enough to be able to use these principles
• comparison:It is divided into horizontal and vertical comparisons, such as vertical and sequential analysis, horizontal and different products, and different channels.
• Movement (change):The index varies with time, which is the growth rate (compared with the previous year and the previous month).
• distribution:This is a good understanding, such as the classification of different ages of users, distribution of different occupations, different geographical distribution, etc.
• subdivision:From the multi-level to understand the data, such as the analysis of the specific order data of different cities in different provinces in the country, from the country to the provinces – the city of the drill down in-depth analysis;
• transform:It is mainly reflected in the final transformation of the results and the transformation of each path, such as the transformation analysis of the whole registration process to optimize the details.
• prediction:Based on the current situation, the index value of the next analysis period is estimated.
Case
A fruit O2O platform to confirm the number of each category should be prepared within a week, if no data support, and that only by artificial experience combined with a general conclusion, average error is larger in fruit waste more. How do you solve this problem? When there is the usual data, data trends, have certain rules can be obtained through the data to predict a more reasonable and more accurate numerical, and an optimal scheme is obtained by continuous prediction – validation, guarantee good fruit stock just, reduce waste, cost savings, this is the value of the data.
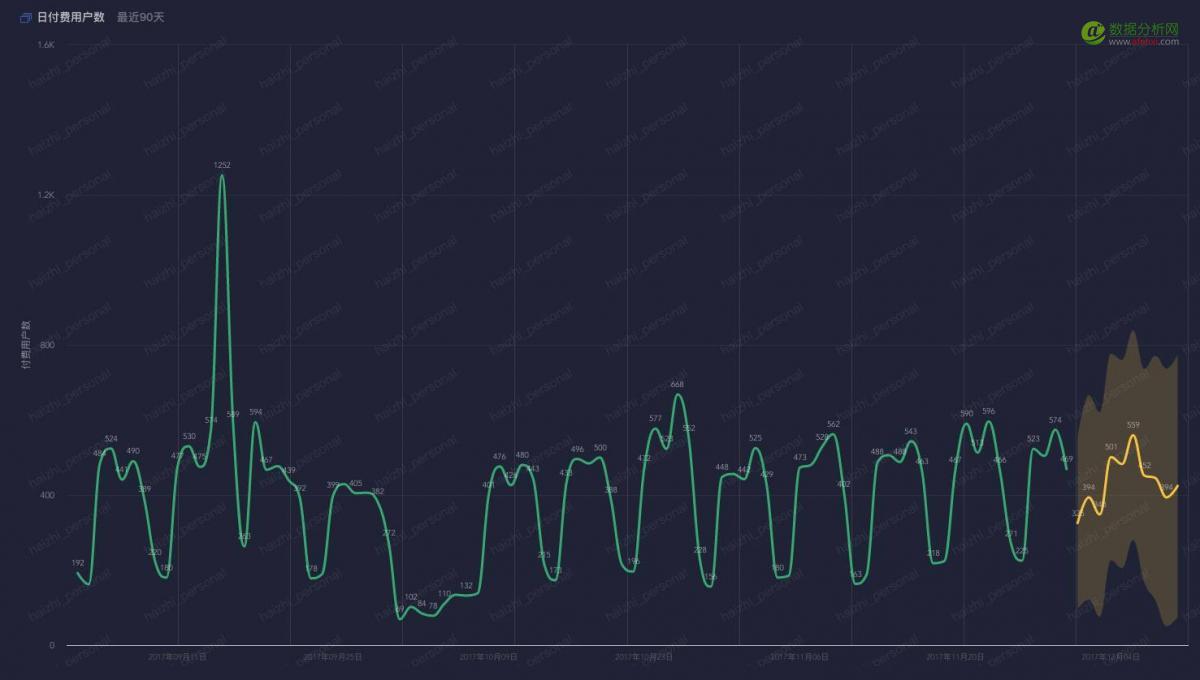
(green: daily data trend; Yellow: data forecast for the next 10 days
Waiting for an analyst’s long schedule? Can you do your own analysis?
Data analysis, an analyst with multiple departments, sometimes needs to get data from, 2, 3 days have passed, quite apart from the analysis results is what you want, in terms of timeliness, the meaning of the data results also decreases, how to change its own “exclusive analysts’ ~
The whole process of data analysis:Identify indicators — data collection — data integration, data processing/modeling, data analysis, data presentation, and report reporting.
• determining index:I’m not going to talk about it, but let’s go to the first problem.
• data collection:It can be obtained through the company database, which can be obtained through a third-party platform and obtained through some recorded local data.
• data integration:Operating people who want to see too many data, a database, there are all sorts of the third platform of data (their Allies, statistics, marketing, public, etc.), each time need to fetch the data from different platforms, is too scattered, it is best to centralized management of data in a data platform.
• data analysis:The method of reference analysis, such as “summing, counting, same-month, multi-granularity,” etc., is generally solved by writing formula in excel.
• Data presentation (visualization):To put it simply, how to make a map, please learn the third question directly.
• reporting:Report the data to the leader through tables, charts, or other forms.
How do you not rely on analysts to do your own data analysis?
(1)Learn some data analysis theories. (data thinking)
(2)It’s important to know and be familiar with your business. (business ideas)
(3)Learn some data analysis tools. (tool assist)
In my personal experience, it is enough to really grasp these facts. After all, we are not professional data analysts, and we can do business analysis well enough!
How to make a good picture of the owner’s satisfaction?
No boss likes cluttered form data, and the level of appearance is king. To put it simply, it’s how data is visualized, which makes the data intuitive and intuitive.
• Analyze the proportion of data:The data of single dimension can be used for the proportion of available pie/ring graph and the data proportion of the analysis of the dimensions, which can be used for the sunrise and rectangular tree plots.
For example, the user sex ratio analysis only “gender” one dimension,useBread/graphic),Male to female ratio is intuitive, such as below are male users more obviously, if a user group in line with the original intention and product characteristics, the way they operate might as well try some “cute”, perhaps this can attract more male customers. Marketing campaigns can also consider selecting a number of technology products as prizes, which may promote the purchasing power of male users and achieve the purpose of activities.
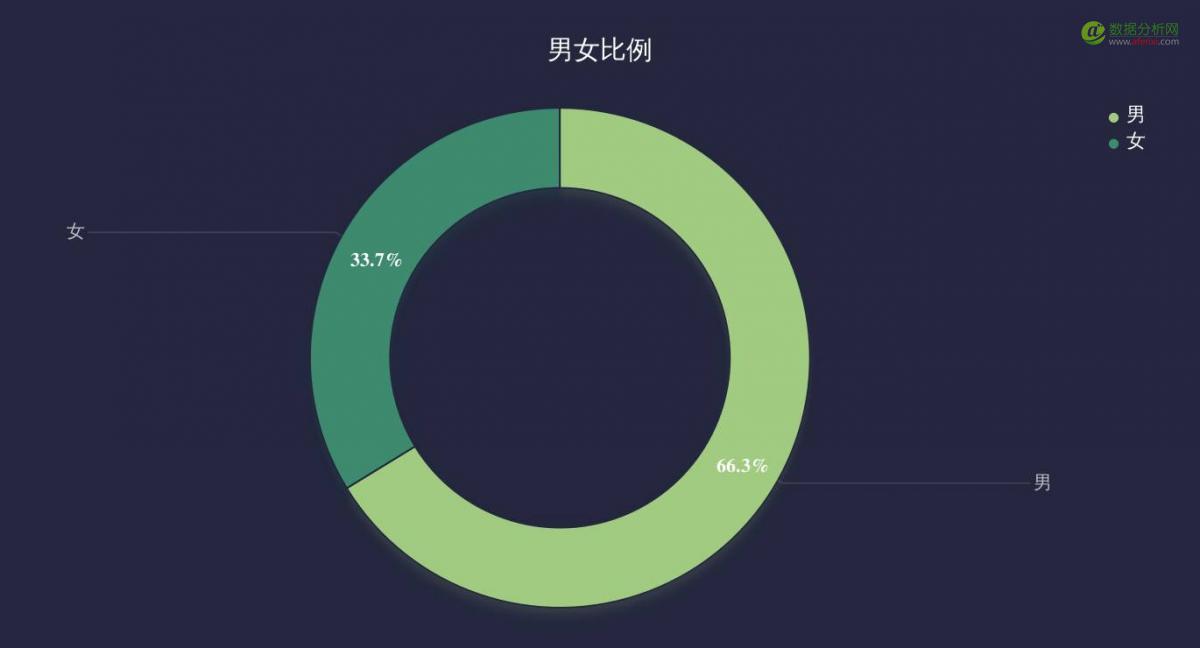
(single dimension: user gender analysis)
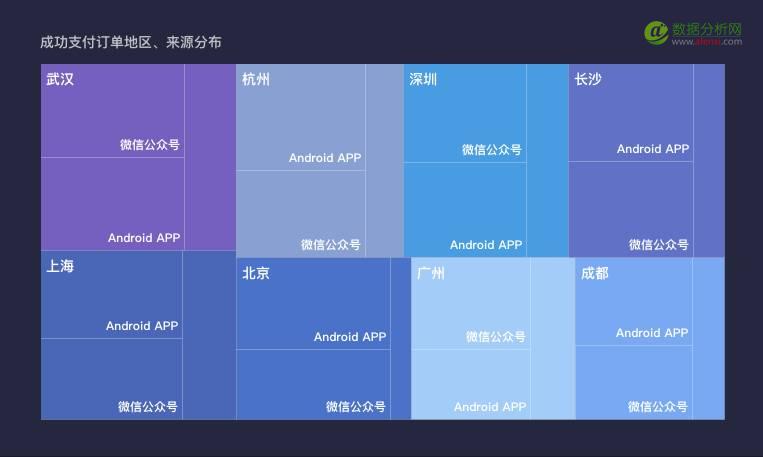
(multidimensional: order analysis of different channels in different regions)
• Analyze the data with the sequential trend:Analysis of the single dimension of the same month can be used in the same monthBiaxial figure。
It is too common to be seen on the same month, and almost all of the data have to be compared to the previous one, so that the “operational value” of the data can be reflected.
The most common is PV, UV and the same month, such as the UV month down, is normal or abnormal. The normal reason is that there may be a certain rule of UV, which may be lower than Thursday, and that data is normal. If there is no regular pattern, the abnormal fluctuation must look for the reason behind, handle the problem as soon as possible, in case of recidivism.
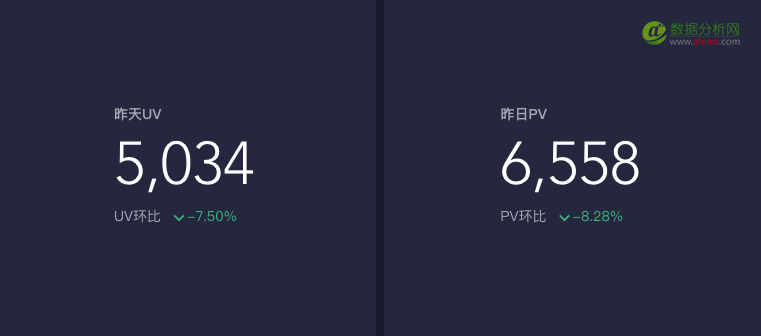
(Single dimension: PV is separated from the UV)
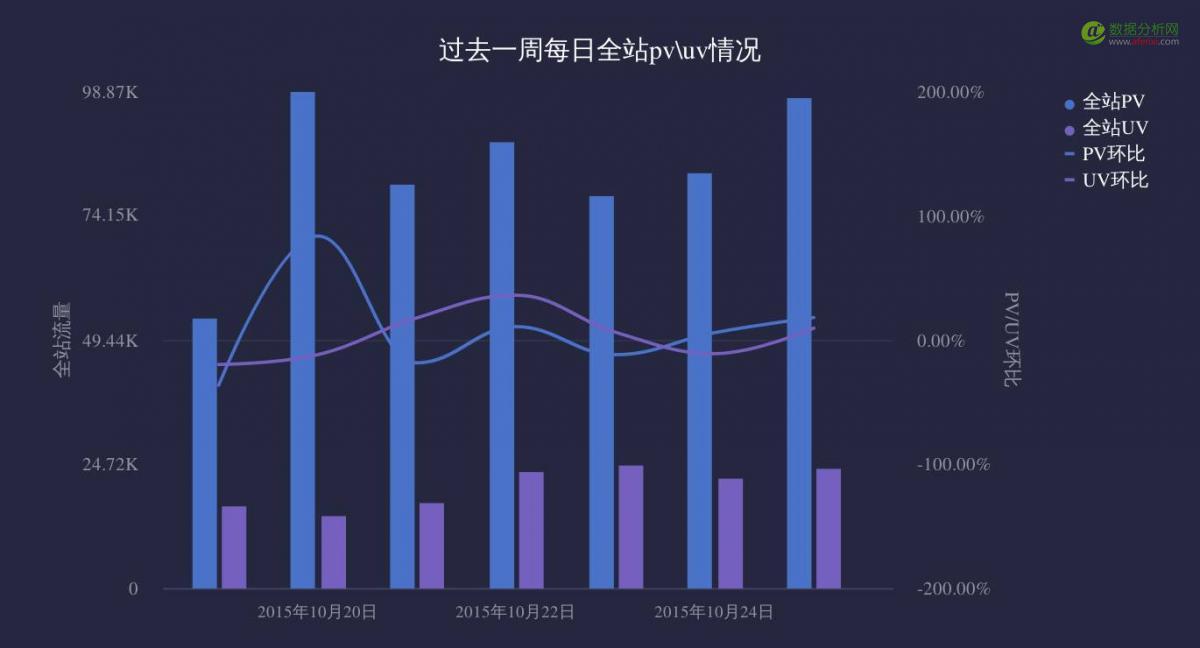
(Double dimension: PV and UV are put together)
• Analysis data trend:the most commonly used is…Line drawing, bar graphAlso can be expressed, the intuition is slightly lower than the line graph.
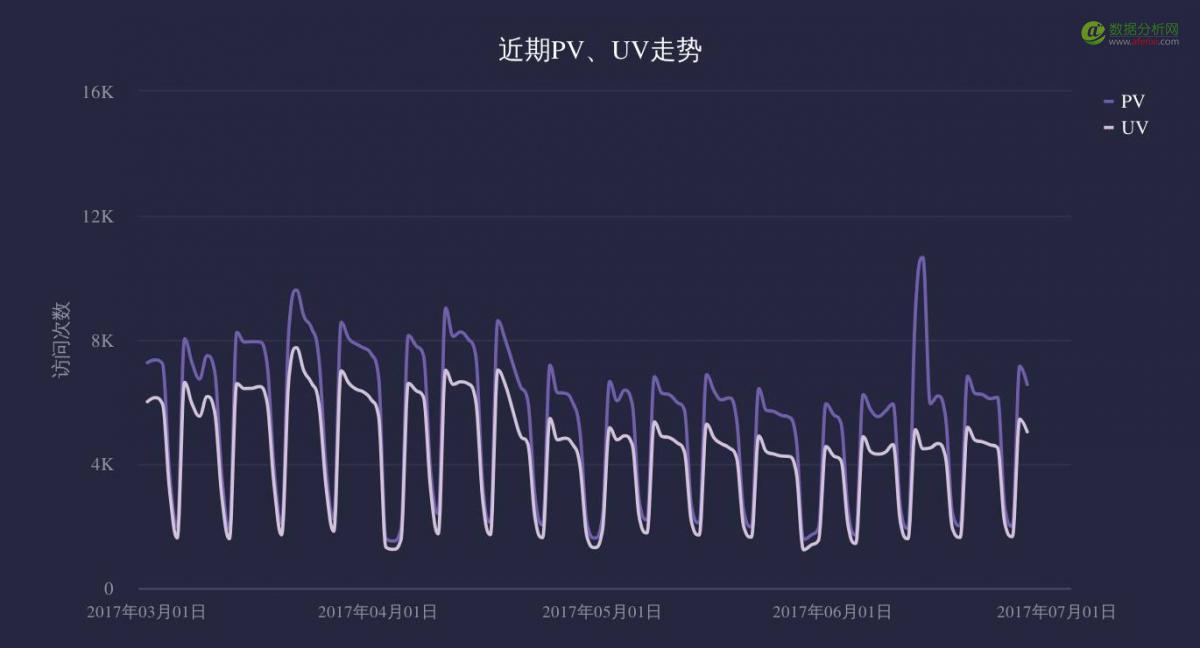
(line chart)
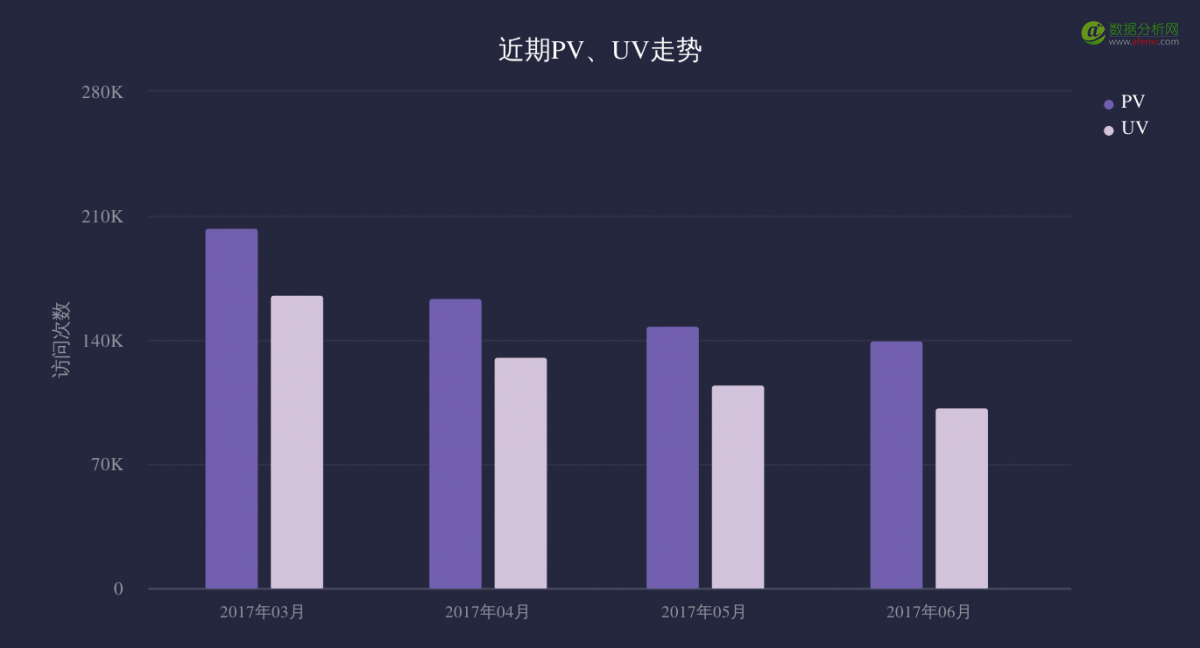
(bar graph)
• Analysis of regional distribution:National and provincial distributions are availableAdministrative map,More detailed geographical distribution is availableLatitude map。
User geographic analysis is also very important, which may determine which areas the company’s business will focus on and focus on sales. This is what is required to focus on the company’s advertising data of the regional guidance, for every bidding in the company the millions and millions and correct user geographical analysis can save a lot of unnecessary investment, to save money for the company boss can be pleased.
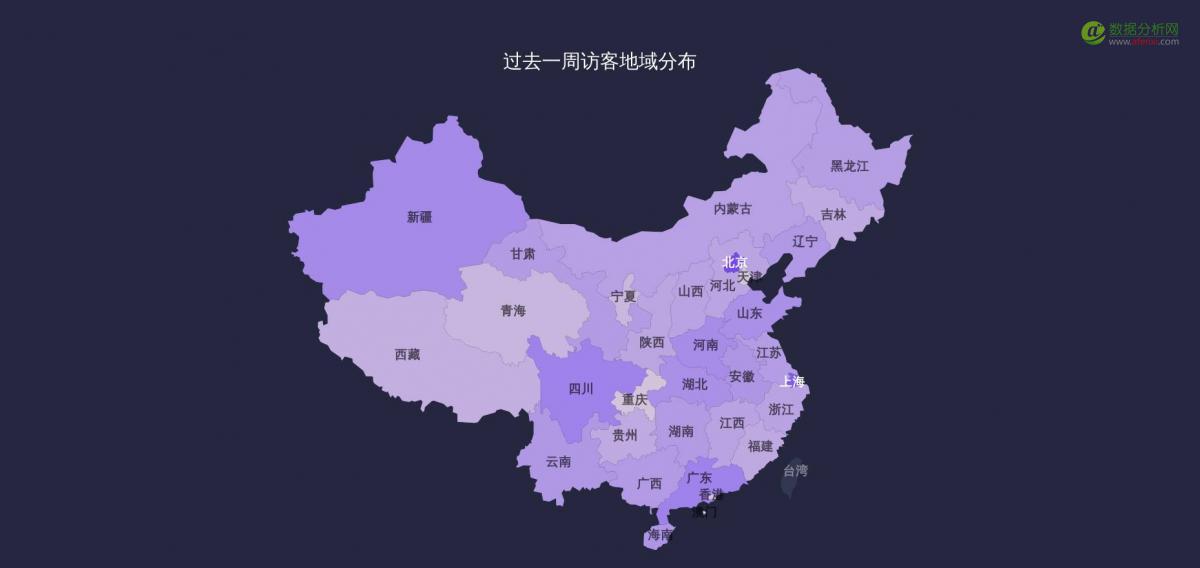
(Administrative map)
(Dynamic map of the area of shenyang)
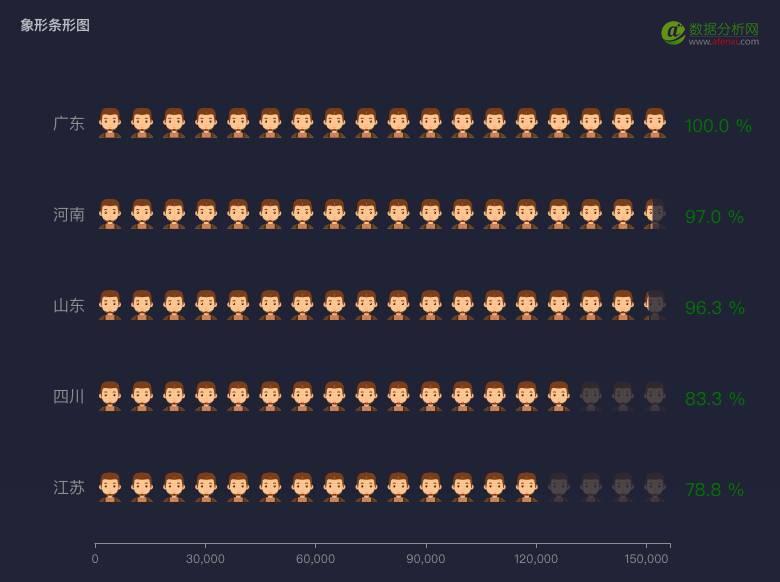
(The number of registered users in each province was completed)
• Analyze task progress:Single indicator progress is availableMeasuring figure,Multi-indicator progress is availableThe bullet figure,the completion is clear
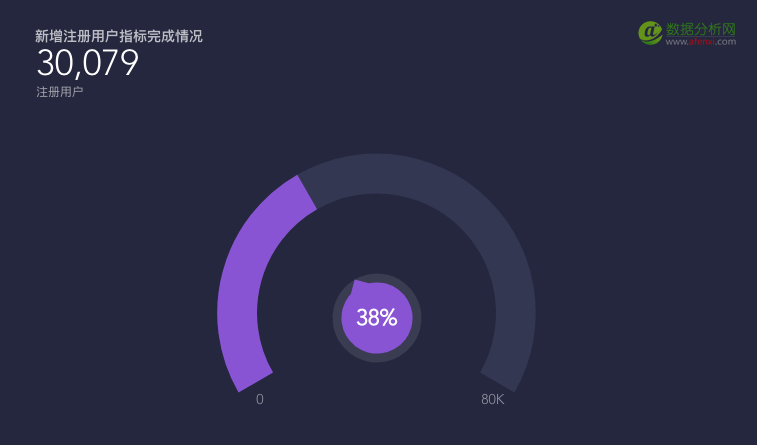
(KPI fulfillment of schedule)
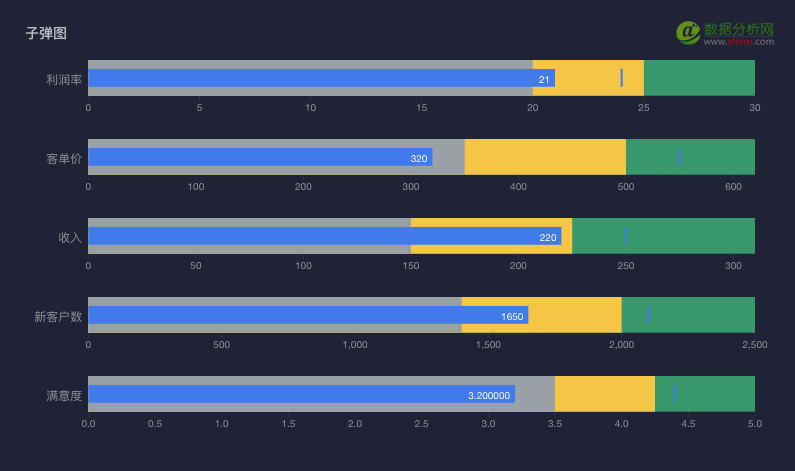
(The various indicators are completed)
• Analyze user activity change:useSankey diagram。
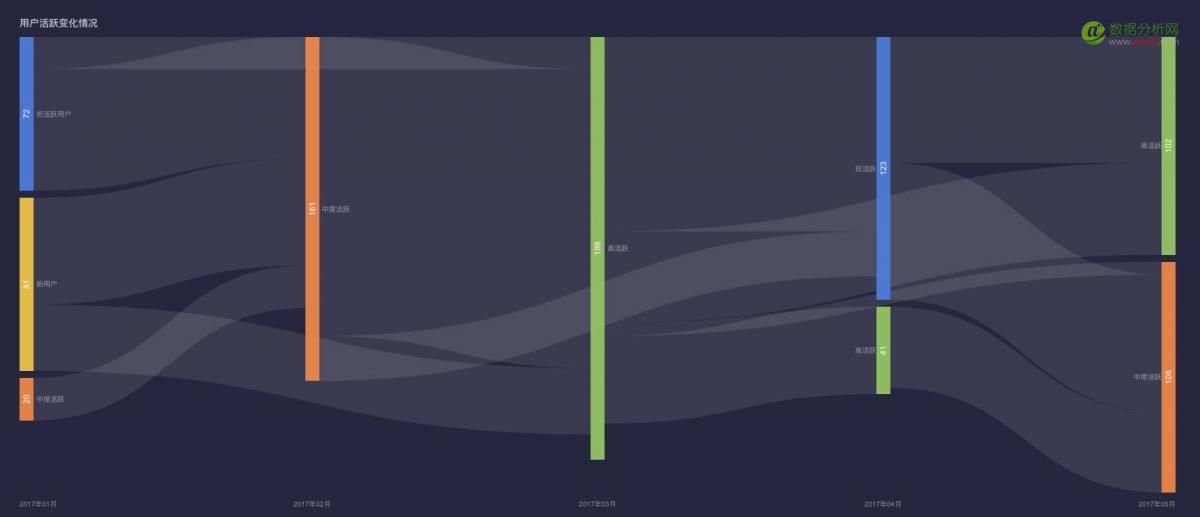
(User activity changes)
• Analysis of word frequency: Like the user’s job distribution,useWord Cloud,It has a 3D effect.

(User position distribution)
•Analytic transformation effect: usefunnel plot.
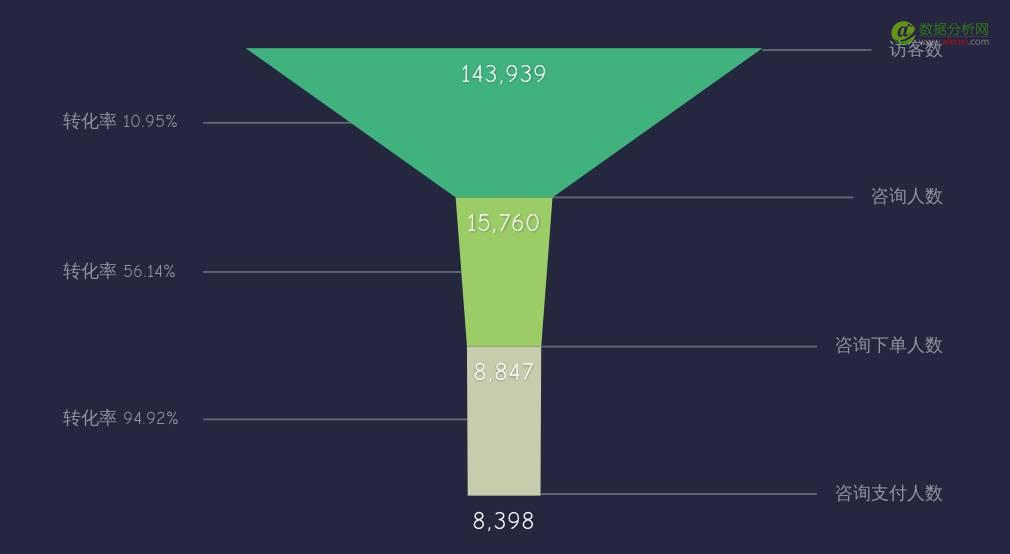
(User consultation conversion rate)
Transformation of case
Before working in a home appliance business company, every site traffic is not low, but the final payment conversion rate is not high, always from traffic – registration can also, in the scan conversion are registered – you can also, but just browsing – pay is not high. By constantly looking for reasons, through the user survey and data analysis (buried) found that most of the users to the payment page, but not so obviously pay for entry in the mobile terminal has caused many users to refuse to buy, I need to change this, of course, the optimized overall conversion rate is increased. It’s really a virtuous cycle through data discovery – the reason – optimization – through data validation
Each chart has a suitable usage scenario, and it is important to use a variety of charts to directly affect the intuitive and aesthetic degree of data.
How to quickly find the problem behind the data?
With so much data work, it’s all about finding problems from the data and optimizing the operational strategy. Whether the data is going up or down, there must be a reason for its change. Here, take the change of user data as an example to find out the way to find the problem quickly
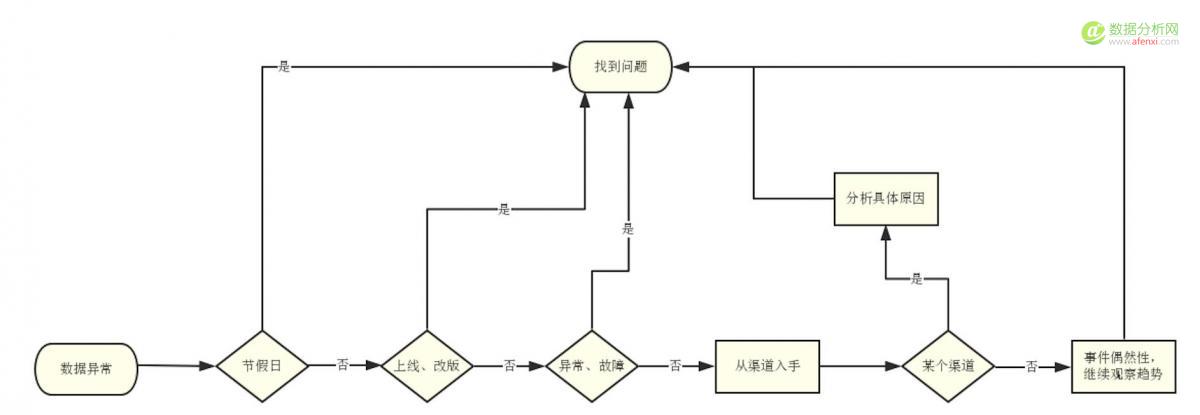
• Holiday fluctuation:Most products are affected by holidays and weekends, while office software holidays/weekend data tend to drop, and e-commerce product holidays/weekend data generally rise.
• Online and revised:There are different online orders, such as the launch of marketing activities and new advertising channels. Any changes in the website can be interpreted as “on-line”.
• Exception, failure:Server failure, channel forced offline, website access, link exceptions, link access is not a common situation.
The above three kinds are not, then drill down from the channel to start, see which channel data have abnormality, combine specific problem to undertake analysis. (Ps: sometimes exceptions are found from channels, so the order of this process is not absolute)
None of the above is true, I can’t find the reason, I can only say to the boss: “the reason is not clear, will continue to observe the trend, to confirm its contingency”.
Some of the problems are obvious, some of them need some time to check, and the final meaning of the data should be combined with practice. See the data, find problems, solve the problem, then look at the data, problem solving, or see the data – found that growth – find out why – continue to application, in a word: take the essence to the dregs, you know ~
本文来源于数据分析网,作者海致BDP。