

 中文
中文You Still Don’t Know Cohort Analysis?
A pretty average number is created with the data of virtual scene, will give our decision making misleading, so we need to acquire an effective method to analyze the real user behavior and user value, this method is a Cohort Analysis (Cohort Analysis).In fact, the data does not lie, but the analysis of the data is not accurate analysis and leads to the incorrect interpretation of the data.
At the same time, there are relatively few studies related to the group analysis in China. Perhaps not all operations know about the group analysis in the same period, but it is a necessary analysis method for every product operation.In the famous “lean data analysis”, the soul of test data analysis also mentions the relevant content of group analysis in the same period.
In the same period, group analysis was first used in the field of medical research to observe how the behavior of different subjects varied with time.By monitoring different groups of subjects, medical researchers can observe the effects of different prescriptions and treatments on the subjects and determine the Shared behavioral patterns.
So in terms of operations, what is the same cohort?
In the same period, the group belongs to a subgroup of users, which refers to the group of users who have the characteristics of common behavior within the specified time.“Common behavior” refers to the similar behavior in a certain time period, which in addition to sort them out according to different time of new users, may be classified according to different behaviors, such as “in June 2017 for the first time to buy”, “on the second week of October, 2017 products began to reduce the use of frequency”, etc.
Note that the cluster analysis focuses on the differences between groups during the same phase of the customer’s life cycle.
Why is Cohort Analysis important?
In the process of product development, we usually measure product revenue and product user volume as the ultimate measure of success or failure of this product.There is no denying that these indicators are important, but they could not be used to measure the product’s success recently, and most likely will hide some issues which need our attention, such as user engagement has been falling, added in gradually slow, etc.On the analysis of user behavior in the process, we need more detailed measures, so that is better for us to accurately predict product development and by version iteration in a timely manner to product optimization and improvement.
Cohort Analysis is the key to improving the retention of APP users
The success of a product, it says, is not how many downloads it is, but how to keep losing users and how to recall them.
We can’t through downloads to determine the specific situation of the development of the APP, because beautiful download data will mislead us thought APP development is very healthy, but in fact, many users download is lost in a few days.Group analysis is the key to improve user retention.
case
For the first time, users of the APP were analyzed in the same time group and observed their retention for the next seven days.

17461 new users start the APP, for the first time in October 30, with 30.6% of people in these users on the first day to start again, the fourth day 12.2%, 7.9% on the seventh day, and this shows that at the time of the seventh day approximately once every 12 users only one active users.It also means we lose 92% of our users
We need to know which groups have better retention and analyze why.Have we launched a new marketing campaign on that day?Or offers promotions or discounts?Or new features that add video to the product?We can apply these successful strategies to other users to improve user activity and retention.We can also compare the retention of different time periods:
• The preservation of the new lads:
By comparing the different time groups, we can see four days, seven days and so on.These data can give us the key information about user login experience, product quality, user experience, and market demand for products.
• Long-term retention:
By looking at the number of days a group of users are returning to use the APP again, we can see the long-term retention of each cohort, rather than the remaining days of the new APP.
We can know where the user is out, and you can know what’s the feature of active users, what they are doing and so on the one hand, will help us in new quickly find target users, on the other hand we can also affect the new users, let them follow the same route, eventually become loyal users.
Cohort Analysis can help us monitor real user behavior, measure user value and develop targeted marketing programs in real time
For example, our operations team launched a 60-day welcome campaign in September to promote user growth through a series of discounts and offers.Through advertising and social media, we have thousands of users growing every day.Five months later, our user growth was very large, and the leader was very satisfied with the result of our activity.
On the face of it, we have achieved the goal of user growth.However, when we study cohort data, starting from the lifetime value of customers, we will find that new users welcome activities in activity 2 months after purchase rate continue to reduce, by contrast, activity before the new users such as users in August, in the activities of this five months purchase rate has been stable.
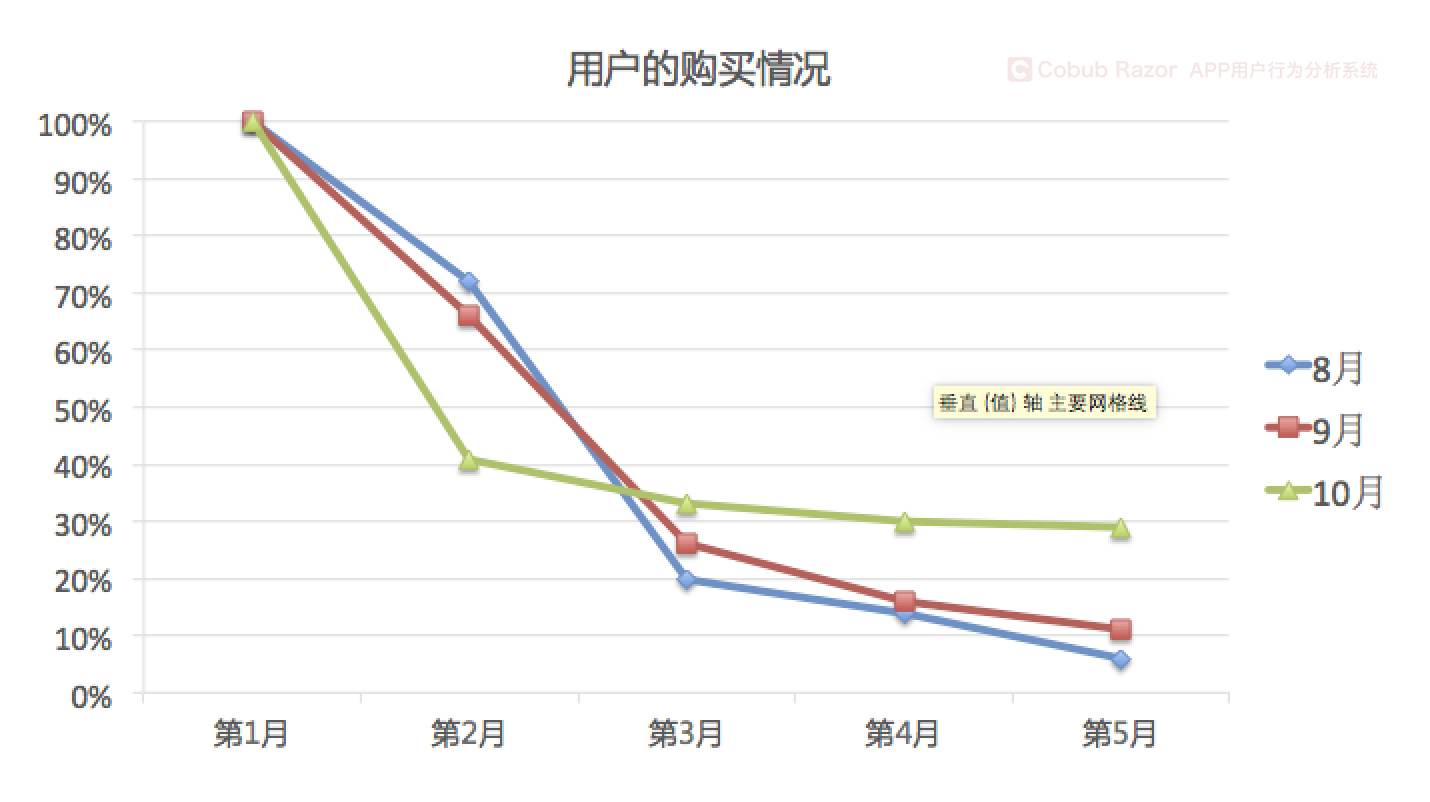
If we only measure our monthly gross income as a measure, we expect revenue growth to come only from the new influx of users.However, user group data following the launch of the activity shows that once the discount activity is over, revenue will decline.The decline in revenue proves that we have not expanded our loyal user base.
As shown above, through the cohort analysis we can real-time monitoring the real user behavior trend, otherwise, we will get wrong judgment because only analyze the overall data and make the wrong decision.By analyzing the behavioral differences of each cohort, we can develop targeted marketing programs.In this case, the operator needs to develop a new strategy to improve user engagement after two months of activity.
How to implement Cohort Analysis?
Start by defining business questions
Defining a business query is a prerequisite for the study of effective results.Business questions define business goals and research attempts to solve them.
Does the customer purchase conversion rate increase after we optimize the product?Is the user turnover rate reduced after the product improvement?We need to iterate and refine these questions to ensure that it is aligned with business objectives.
Define metrics based on business queries
If the purchase conversion rate and user retention rate are the key indicators to answer business questions, we want to understand the user turnover rate and the final purchase conversion rate from registration to completion of purchase.
Definition cohort
In the previous cases, the group was based on the user who purchased the account within a week of creating an account.In other cases, we can define a group in a different way, for example, a content APP that we might post within 24 hours of creating an account.
Analyze group data over the same period
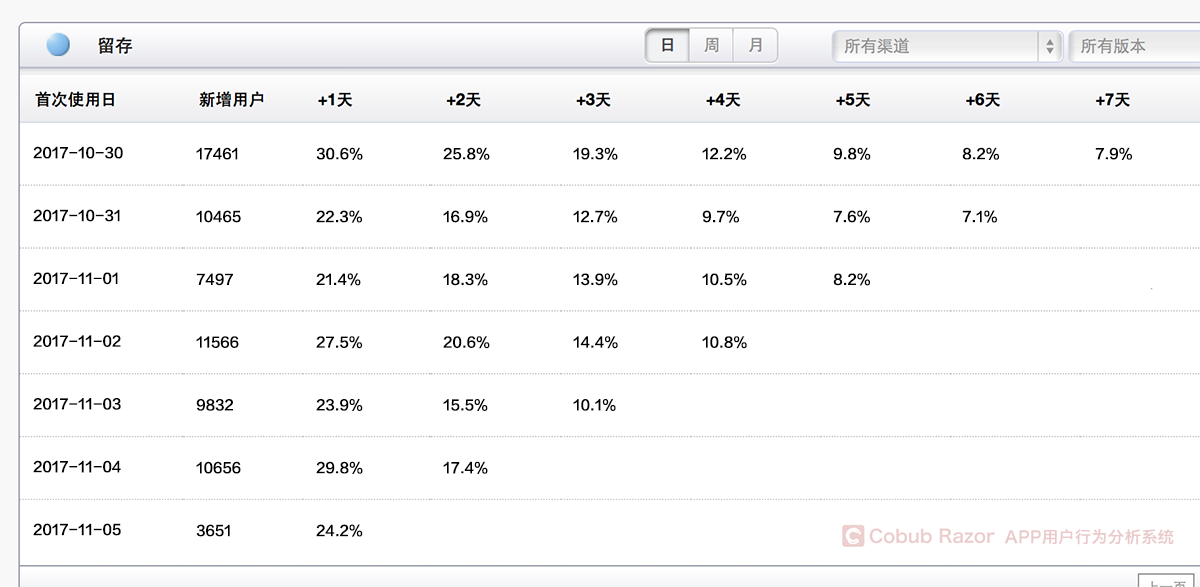
We also in a cohort of typical form, for example, rows horizontally for natural number, longitudinal for every new clients, forms the internal is to calculate retention rate every day, usually the retention rate of lateral will stay some days later in a relatively stable state, we can see from the picture, keep stable in 5 days.This means that the users are stable.Otherwise, if the retention rate keeps going down, it’s going to go to zero someday.
Let’s look at the longitudinal retention data, and if a product is in healthy development, this data should be getting better and better.Obviously this product is not, the PM should constantly improve the product according to the historical data, improve the user experience, thus improve the retention rate!
Conclusion
Cohort Analysis in the same period will help us to analyze user behavior more deeply and reveal the problems covered by the overall measure.In the current situation where the marketing mode and the activity effect are changing, learning to use the same period group analysis can help us to predict the future income and product development trends.